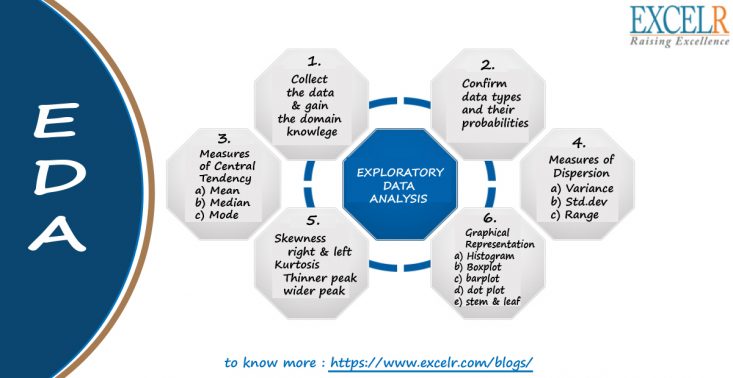
Exploratory Data Analysis (EDA) is an approach/philosophy for data analysis that employs a variety of techniques (mostly graphical)
EDA is an iterative cycle. You:
- Generate questions about your data.
- Search for answers by visualising, transforming, and modelling your data.
- Use what you learn to refine your questions and/or generate new questions.
EDA is not a formal process with a strict set of rules. More than anything, EDA is a state of mind.
During the initial phases of EDA you should feel free to investigate every idea that occurs to you.
Some of these ideas will pan out, and some will be dead ends. As your exploration continues, you
will home in on a few particularly productive areas that you’ll eventually write up and communicate
to others.
EDA is an important part of any data analysis, even if the questions are handed to you on a platter,
because you always need to investigate the quality of your data. Data cleaning is just one
application of EDA: you ask questions about whether your data meets your expectations or not. To
do data cleaning, you’ll need to deploy all the tools of EDA: visualisation, transformation, and
modelling.
What is Exploratory Data Analysis (EDA)?
- How to ensure you are ready to use machine learning algorithms in a project?
- How to choose the most suitable algorithms for your data set?
- How to define the feature variables that can potentially be used for machine learning?
Exploratory Data Analysis (EDA) helps to answer all these questions, ensuring the best outcomes
for the project. It is an approach for summarizing, visualizing, and becoming intimately familiar
with the important characteristics of a data set
Value of Exploratory Data Analysis
Exploratory Data Analysis is valuable to data science projects since it allows to get closer to the
certainty that the future results will be valid, correctly interpreted, and applicable to the desired
business contexts. Such level of certainty can be achieved only after raw data is validated and
checked for anomalies, ensuring that the data set was collected without errors. EDA also helps to
find insights that were not evident or worth investigating to business stakeholders and data scientists
but can be very informative about a particular business.
EDA is performed in order to define and refine the selection of feature variables that will be used
for machine learning. Once data scientists become familiar with the data set, they often have to
return to feature engineering step, since the initial features may turn out not to be serving their
intended purpose. Once the EDA stage is complete, data scientists get a firm feature set they need
for supervised and unsupervised machine learning.
Your goal during EDA is to develop an understanding of your data.
The easiest way to do this is to use questions as tools to guide your investigation. When you ask a
question, the question focuses your attention on a specific part of your dataset and helps you decide
which graphs, models, or transformations to make.
EDA is fundamentally a creative process. And like most creative processes, the key to asking
quality questions is to generate a large quantity of questions. It is difficult to ask revealing questions
at the start of your analysis because you do not know what insights are contained in your dataset.
On the other hand, each new question that you ask will expose you to a new aspect of your data and
increase your chance of making a discovery. You can quickly drill down into the most interesting
parts of your data and develop a set of thought-provoking questions if you follow up each question
with a new question based on what you find.
There is no rule about which questions you should ask to guide your research. However, two types
of questions will always be useful for making discoveries within your data. You can loosely word
these questions as:
- What type of variation occurs within my variables?
- What type of covariation occurs between my variables?
I’ll explain what variation and covariation are, and I’ll show you several ways to answer each
question. To make the discussion easier, let’s define some terms:
- A variable is a quantity, quality, or property that you can measure.
- A value is the state of a variable when you measure it. The value of a variable may change from measurement to measurement.
- An observation is a set of measurements made under similar conditions (you usually make all of the measurements in an observation at the same time and on the same object). An observation will contain several values, each associated with a different variable. I’ll sometimes refer to an observation as a data point.
- Tabular data is a set of values, each associated with a variable and an observation. Tabular data is tidy if each value is placed in its own “cell”, each variable in its own column, and each observation in its own row.
Variation
Variation is the tendency of the values of a variable to change from measurement to measurement.
You can see variation easily in real life; if you measure any continuous variable twice, you will get
two different results. This is true even if you measure quantities that are constant, like the speed of
light. Each of your measurements will include a small amount of error that varies from
measurement to measurement. Categorical variables can also vary if you measure across different
subjects (e.g. the eye colors of different people), or different times (e.g. the energy levels of an
electron at different moments). Every variable has its own pattern of variation, which can reveal
interesting information. The best way to understand that pattern is to visualise the distribution of the
variable’s values.
Covariation
If variation describes the behavior within a variable, covariation describes the behavior between
variables. Covariation is the tendency for the values of two or more variables to vary together in a
related way. The best way to spot covariation is to visualise the relationship between two or more
variables. How you do that should again depend on the type of variables involved.
What is EDA Used For?
EDA is used for:
- Catching mistakes and anomalies
- Gaining new insights into data
- Detecting outliers in data
- Testing assumptions
- Identifying important factors in the data
- Understanding relationships
And perhaps, most importantly, EDA is used to help figure out our next steps with respect to the
data. For instance, we might have new questions we need answered or new research we need to
conduct.
Purpose
The primary goal of EDA is to maximize the analyst's insight into a data set and into the underlying
structure of a data set, while providing all of the specific items that an analyst would want to extract
from a data set, such as: a good-fitting, parsimonious model. a list of outliers.


