
Power BI Certification Training
PowerBI is one of the most popular data visualisation and BI tools in the industry and used by most of the data analysis professionals across the globe.
With Two Value Added Self-Paced Courses
- Tableau
- MySQL


You May Have Heard About Offers, But Have You Heard Of ExcelR's JUMBO PASS? Well, Here's Your Chance To Avail The JUMBO PASS!! Watch The video

Course Description

Assignments & Case Studies

Real-life PowerBI Project

Job Readiness Program

Lifetime access to LMS
Skills Covered

Data Preparation

Charts
DAX

Dashboard

Story Telling
Why ExcelR

Industry-Based Course Curriculum

Seven Value Added Courses

Work Hands-on with 100+ Hours of Internship and 10+ Bootcamps

Guaranteed Job Interview Calls with our 2000+ partner companies

Support through WhatsApp, Calls, & Emails

Lifetime eLearning Access
Projects
Project 1: Healthcare Analytics
- Build a dashboard which demonstrates the patients summary under dialysis, hospital summary with rating and performance scores, filtered with respect to the chain organizations and hospitals over the period of time.as GitHub or with your own custom plugin. With AWS CodePipeline, you only pay for what you use. There are no upfront fees or long-term commitment.
Project 2: Finance Analytics
- Build a dashboard which represents the loan amount status of the employees working under different sectors with a drill down approach to see the employee details across various regions and payment schedules.
Project 3:HR Analytics
- Narrate a story using a dashboard that demystifies the employees' attrition rate working under the varied companies under different roles and departments with more details such as promotion, salary, job satisfaction etc.
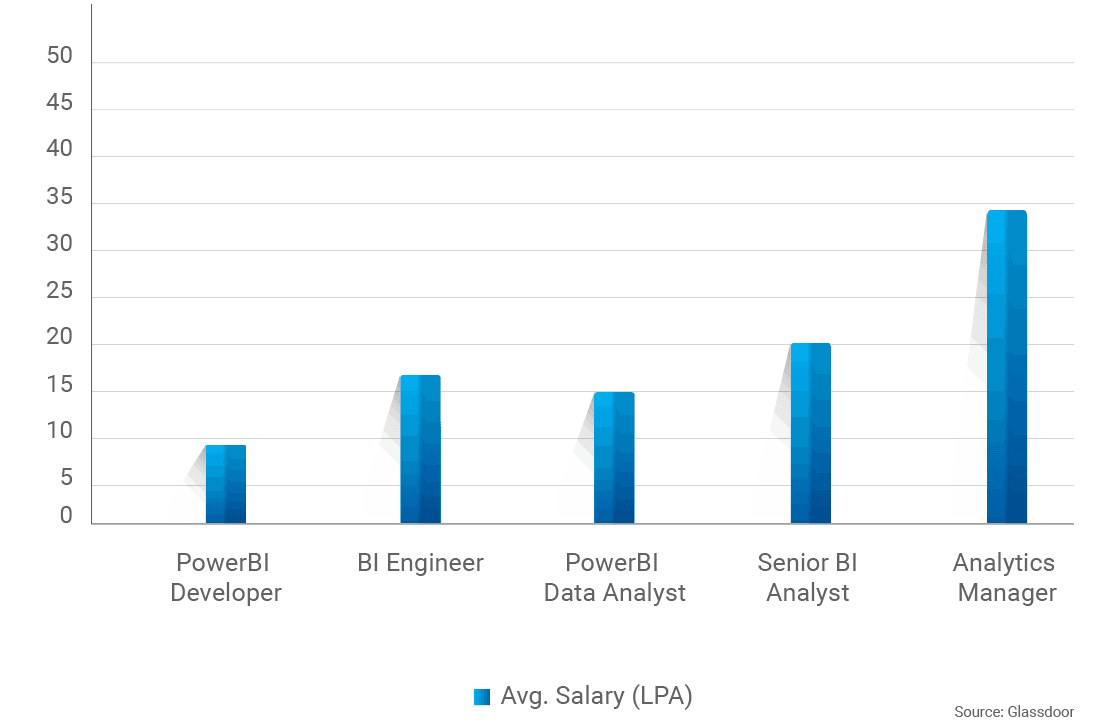
Salary Comparison Data
Course Curriculum
Module 1 - Power BI Introduction
- Introduction to Power BI Desktop
- Getting data (Excel and RDBMS, Web, SharePoint)
- Naming for Q&A
- Direct Query vs Import data
Module 2 - Modelling with Power BI
- Introduction to Modelling
- Set up and Manager relationships
- Cardinality and cross filtering
- Creating hierarchy in the model
- Default summarization and sort by
- Creating calculated columns
- Creating measures and quick measures
Module 3 - Power BI Desktop Visualizations
- Creating visuals
- Colour and conditional formatting
- Setting sort order
- Scatter and bubble charts and play axis
- Tool tips
- Slicers, timeline Slicers and sync Slicers
- cross filtering and highlighting
- Visual, Page and Report level filters
- Drill down/up
- Hierarchies
- Constant Lines
- Tables, Matrix and Table conditional formatting
- KPI’s, Cards and Gauges
- Map Visualizations
- Custom visuals
- Managing and Arranging
- Drill Through
- Custom Report themes
- Grouping and binning
- Bookmark and buttons
Module 4 -DAX Expressions
- Introduction to Dax (how to write Dax and basic functions in Power BI)
- Important Dax used in Power BI along with its applications.
- how to create calculated columns and measures in Power BI and difference in its application
- Scenarios with Questions on Dax & explanation
- Creating date dimension in Power BI using calendar functions and its importance
Module 5 - Publishing and Sharing
- Sharing options
- Publish from Power BI Desktop
- Publish reports to Web
- Sharing reports and Dashboards
- Workspaces
- Apps
- Printing, PDF’s and exports
- Row level Security
- Exporting data from Visualizations Refreshing Datasets
- Understanding data refresh
- Gateways
Contact Our Team of Experts
Why ExcelR?
FAQs
What Is JUMBO PASS?
- The all new and exclusive JUMBO PASS is the latest initiative taken by ExcelR to offer you access to attend unlimited batches over the duration of 365 days. You will be able to attend unlimited number of classes for the course of your choice.
What is Data Visualization?
- Data visualisation is all about telling a story using visual graphics/images which cannot be told by data alone. Data visualisation should not be mistaken for beautiful aesthetic visuals, however it is about solving business problems.
Are data visualisation concepts required for me to be a Data Scientist?
- Yes, data visualisation is mandatory for all data scientists because they are expected to present the products / solutions to the clients. There are also jobs on data visualisation alone and Power BI alone.
Why should I choose ExcelR & not other training institute?
- Our trainers have 15+ years of experience in the field of their expertise from prestigious colleges such as IIT, ISB, IIM, etc. Also the training content which ExcelR provides is incomparable with any other training institute. We provide Power BI training which makes your profile complete.
What Is Instructor-Led Online Training?
- Instructor-led online training is an interactive mode of training where participants and trainer will log in at the same time and live sessions will be done virtually. These sessions will provide scope for active interaction between you and the trainer.
How Many Batches Can I Attend, If Enrolled For Training?
- ExcelR offers a blended model of learning. In this model, you can attend classroom, instructor-led live online and e-learning (recorded sessions) with a single enrolment. A combination of these 3 will produce a synergistic impact on the learning. You can attend multiple Instructor-led live online sessions for one year from different trainers at no additional cost with the all new and exclusive JUMBO PASS.
Is This A Live Training Or Recorded Sessions?
- It is a live instructor-led interactive session which is done at a specific time where participants and trainer will log in at the same time. The same session will be also recorded and access will be provided to revise, recap or watch any missed session.
What If I Miss A Live Session?
- Not a problem even if you miss a live Power BI session for some reason. Every session will be recorded and access will be given to all the videos on ExcelR’s state-of-the-art Learning Management System (LMS). You can watch the recorded Power BI sessions at your own pace and convenience.
Will I Get A Power BI Course Completion Certification From ExcelR?
- Yes, after successfully completing the course you will be awarded a course completion certificate from ExcelR.
Whom Should I Contact If I Want More Information About The Training?
- You can reach out to us by visiting our website and interact with our live chat support team. Our customer service representatives will assist you with all your queries. You can also send us an email at enquiry@excelr.com with your query. Our Subject Matter Experts / Sales Team will clarify your queries or call us on 1800-212-2121 (Toll-Free number – India), +1(281) 971-3065 (USA), 800 800 9706 (India), 203-514-6638 (United Kingdom), 128-520-3240 (Australia).
What Are The Different Modes Of Payment Available?
- The different payment methods accepted by us are
- Cash
- Net Banking
- Cheque
- Debit Card
- Credit Card
- PayPal
- Visa
- Mastercard
- American Express
- Discover
Global Presence
ExcelR is a training and consulting firm with its global headquarters in Houston, Texas, USA. Alongside to catering to the tailored needs of students, professionals, corporates and educational institutions across multiple locations, ExcelR opened its offices in multiple strategic locations such as Australia, Malaysia for the ASEAN market, Canada, UK, Romania taking into account the Eastern Europe and South Africa. In addition to these offices, ExcelR believes in building and nurturing future entrepreneurs through its Franchise verticals and hence has awarded in excess of 30 franchises across the globe. This ensures that our quality education and related services reach out to all corners of the world. Furthermore, this resonates with our global strategy of catering to the needs of bridging the gap between the industry and academia globally.
