Your credit application gets rejected. The AI system does not explain a generic "does not meet criteria" message. A qualified job candidate never makes it past the automated screening. Your insurance premium suddenly increases with no clear reason. These scenarios happen thousands of times daily across enterprise systems, and they often point to a larger problem: algorithmic bias occurring without accountability.
When decision systems affect people's financial futures, career opportunities, and access to services, understanding how these systems process decisions becomes much more important (and of the hour). Finding bias is just the first step to it. You also need to be able to explain, trace where it comes from, and provide clear ways to fix it.
Why Standard Bias Detection May Not Be As Efficient
Traditional bias detection tells you problems exist, but rarely explains where they come from. You might find your loan approval system approves 70% of applications from one demographic group but only 40% from another. This difference shows bias, but doesn't tell you if the problem comes from income requirements, zip codes, or hidden patterns in your training data.
Consider this scenario to help you better understand the common patterns in healthcare systems.
A hospital's patient scheduling AI gives certain ethnic groups longer wait times for appointments. Basic statistics show the problem: white patients wait an average of 3 days while Black patients wait 8 days for the same procedures. But without explanation tools, staff can't figure out why.
After implementing explainable detection, they discover the system gives extra weight to "previous appointment history." Since historically underserved communities had fewer past appointments, the AI learns to prioritise patients with longer medical histories at that specific hospital. The bias wasn't programmed in, but the effect harms real patients.
This scenario actually occurred and was documented in research by Virginia Commonwealth University and Santa Clara University, which found that scheduling algorithms cause Black patients to wait about 30% longer than non-Black patients due to being disproportionately placed in overbooked appointment slots.
How Explainable Bias Detection Works
Explainable bias detection combines fairness measurement with transparency techniques. Instead of just flagging differences, it shows you the specific factors and decision paths that create unfair outcomes.
Feature Contribution Analysis
Every decision your system processes uses multiple input factors. Feature contribution analysis shows exactly how each factor affects outcomes for different groups.
Here's a hypothetical example that can help you understand better the patterns researchers have found across tech companies. Let's say a company discovers their resume screening AI has a 45% pass rate for men but only a 20% pass rate for women applying to software engineering roles. That's clearly biased, but understanding why requires deeper analysis.
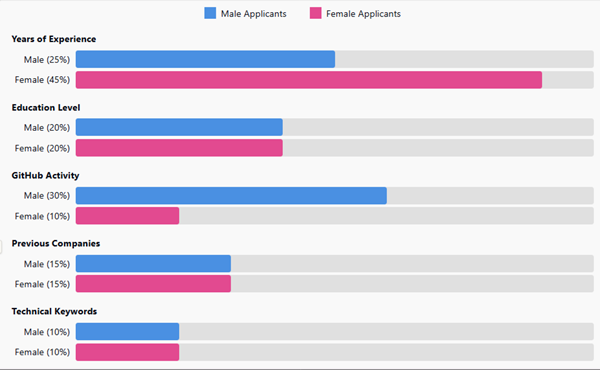
In Fig 1, you can see the problem clearly. The system weights "Years of Experience" almost twice as heavily for women (45%) compared to men (25%). Meanwhile, "GitHub Activity" strongly influences decisions for male candidates (30%) but barely matters for female candidates (10%). This means women need much more experience to overcome the lack of weight given to their technical contributions.
Decision Path Visualisation
When someone asks why they were denied a loan, showing them the exact decision process builds trust and enables corrections. Decision path visualisation traces how your system evaluated each factor.
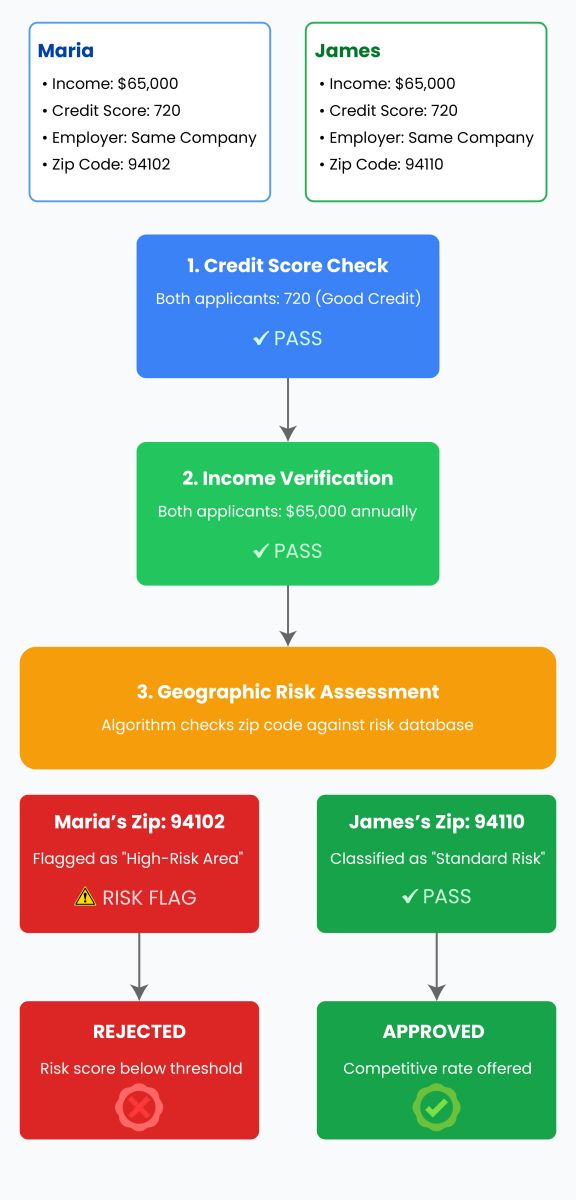
Here's a hypothetical scenario that can help you better understand the common patterns in lending. Two neighbours with nearly identical financial profiles apply for car loans. Maria and James earn $65,000 annually, have credit scores around 720, and work at the same company. Maria gets rejected while James gets approved with a competitive rate.
Fig 2 shows precisely where the bias happens. Both applicants pass the credit and income checks, but Maria's zip code (94102) triggers a "high-risk area" flag. This geographic discrimination drops her risk score below the approval threshold, even though she has the same ability to repay as James.
Research by the National Fair Housing Alliance has documented similar patterns in lending algorithms, with geographic discrimination affecting qualified borrowers through zip code-based decision-making.
Counterfactual Explanations
Counterfactual explanations answer the question "what would need to change for a different outcome?" This approach provides actionable feedback to both system designers and affected individuals.
Consider this hypothetical case that can help you understand better how these explanations work. Sarah applied for health insurance and got placed in a high-risk category with expensive premiums. A counterfactual explanation showed her exactly what the system considered:
- Current BMI: 31 → Needed for standard rate: 29 or below
- Current occupation: Delivery driver → Lower risk occupations: Office worker, teacher
- Current zip code: 48204 (Detroit) → System favours suburban zip codes
- Exercise frequency: Not tracked → Adding fitness app data could help
This transparency exposed serious problems. The system penalised people for living in certain areas and working physical jobs, even though delivery drivers might be more active than office workers. It also favoured people who could afford fitness trackers and lived in suburbs with better healthcare access.
Real Examples of Hidden Bias Patterns
The Resume Scanner That Learned Gender Bias
Amazon discovered that its AI recruiting tool showed bias against women, particularly for technical positions. The system penalised resumes containing the word "women's" (like "women's chess club captain") and downgraded graduates from all-women's colleges. Amazon ultimately scrapped the project when it couldn't eliminate the bias.
Healthcare Algorithms and Racial Bias
A study published in Science found that a widely used healthcare algorithm systematically discriminated against Black patients. The algorithm used healthcare costs as a proxy for health needs, but due to unequal access to care, Black patients had lower costs than equally sick white patients. This meant they were less likely to be referred for extra care despite needing it.
Credit Scoring and Protected Characteristics
Apple Card faced investigation when users discovered that men received credit limits up to 20 times higher than women with similar or better credit scores. Even when couples filed joint tax returns and shared all assets, the algorithm gave vastly different credit limits based on gender.
Image Recognition and Skin Tone
MIT researcher Joy Buolamwini's Gender Shades project revealed that commercial facial recognition systems had error rates up to 34.7% for dark-skinned women compared to 0.8% for light-skinned men.
Moving from Detection to Correction
Once you understand how bias operates, you can take specific action to fix it. Here's how companies successfully correct bias after detecting it:
Explainable detection pinpoints exact factors.
Understand why the bias exists.
Create targeted fixes for specific problems.
Verify fix doesn't create new problems.
Roll out to small group first.
Track fairness metrics continuously.
Fig 3: Systematic approach to correcting detected bias, from identification through implementation and monitoring
Fig 3 is one such approach to fixing bias.
ProPublica's analysis of criminal risk assessment tools led several jurisdictions to revise their algorithms, reducing racial disparities in pretrial detention decisions.
Tools for Explainable Bias Detection
Several platforms now offer explainable bias detection capabilities:
- IBM AI Fairness 360: Provides over 70 fairness metrics with built-in explainability features. The toolkit includes bias detection algorithms developed by IBM Research that can analyse your models at every stage.
- Google What-If Tool: Lets you interactively explore model behaviour without writing code. You can change individual features to see how decisions change and understand which factors matter most.
- Microsoft Fairlearn: Combines bias detection with mitigation strategies. The open-source toolkit helps you understand trade-offs between fairness and model performance.
- SHAP (SHapley Additive exPlanations): Creates detailed feature importance analysis for any machine learning model. Researchers at the University of Washington developed this method based on game theory principles.
- LIME (Local Interpretable Model-agnostic Explanations): Explains individual predictions by learning local approximations. This tool works with any model type, making it useful for proprietary or black-box systems.
- Aequitas: Developed by the University of Chicago, this bias audit toolkit focuses on public policy applications. It helps government agencies and nonprofits ensure their algorithms treat all citizens fairly.
Making Explainable Detection Work in Practice
- Start small with one high-impact system. Pick something that affects many people's lives, like hiring, lending, or healthcare access. Run explainable detection on historical decisions to understand current bias patterns.
- Share findings widely within your company. When engineers see exactly how their models discriminate, they become motivated to fix problems. When executives understand legal and reputational risks, they provide resources for improvements.
- Create standard reports that non-technical stakeholders can understand. A simple dashboard showing "this factor causes 30% lower approval rates for women" communicates better than complex statistical analyses.
Most importantly, involve affected communities in the process. The people experiencing bias often understand its impacts better than data scientists. Their feedback can point you toward problems your metrics might miss.
Conclusion
Explainable bias detection helps turn fairness from an abstract goal into concrete actions. By understanding exactly how bias operates in your systems, you can fix specific problems instead of hoping generic solutions work.
Every biased decision represents a real person denied an opportunity. A qualified teacher rejected by resume screening. A creditworthy family denied a home loan. A patient waiting weeks longer for critical care.
Explainable detection helps you find these injustices and fix them.
As you implement these approaches, remember that transparency builds trust. When people understand how systems process decisions, they can challenge unfair outcomes and suggest improvements. This dialogue between technologists and communities creates AI systems that work fairly for everyone.
.png)