
Multi-Class Classification in R With Imbalanced Dataset
Multi-Class Classification in R with Imbalanced Dataset
In Machine Learning, we come across a large number of datasets. As a fresher, who is learning about machine learning algorithms, the datasets to deal with are simple and easy as one gain more experience, the types of the dataset will be"imbalanced".
Wandering, what is an "Imbalanced" dataset? I will explain.. But before... But before that, know about a balanced dataset.
What Is a"Balanced" Dataset?
While someone is attending the data science class, most of the times, they will be given a
perfectly balanced dataset to practice. By balanced, I mean to say, every level in output
variable., in a classification problem, hasan equal proportion of observations. For example, the
famous iris" dataset.
Below is the R code to load "iris' dataset and to know about the number of observation in
differentSpecies
data ("iris")
table (iris$Species)
setosa versicolor virginica
50 50 50
The dataset is a perfectly balanced dataset, as every species has an equal number of observations.
S0,using the classification algorithms will produce highly accurate results.
What is an"Imbalanced" dataset?
In real time projects,we can never expect work with a balanced dataset. An “imbalanced" dataset is one, in which the proportion of observations in different level is unequal. For example, I have a 'glass" dataset and it has got six types of glasses. Let us look into the number of observation in the different type of glass.
> table (glass$Type.)
1 2 3 5 6 7
70 76 17 13 9 29
Now you can find thatType6 glass hastheleast number,whileType2 hasthemoM. So, I can say that it is an imbalanced dataset.
What Problem one can face if the arelyal making_ model with the imbalanced dataset?
Here, I will make a model using the imbalanced glass dataset, and check the Accuracy of my model. I will use K-NN algorithm
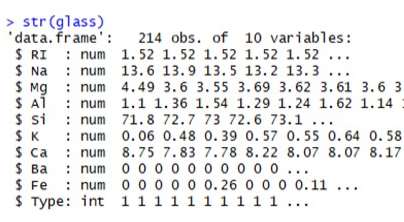
The above code tells us about the structure of the glass closet.You Can see tharType '' variable is in integer format. Use lactor0" function to change it into a factor.
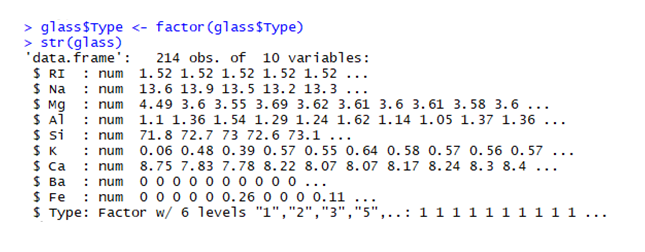
Variable Type got converted into actor. Post this we can look at the proportion of observation in antithese different types of glass levels.
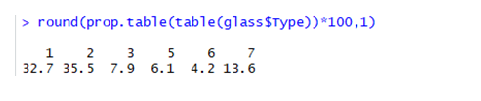
You can see the proportion of type6 glass is very Low compared totype2 glass.
Now, let us look at first 6 observations in our datasets.
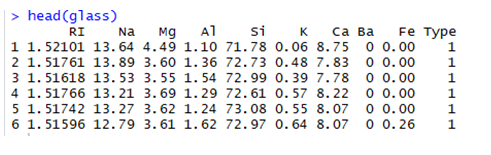
Check that there is a scaling problem in the dataset. So let’s normalize the entire dataset using function and remove ‘Type’ variables,as I don't want it to get normalized.
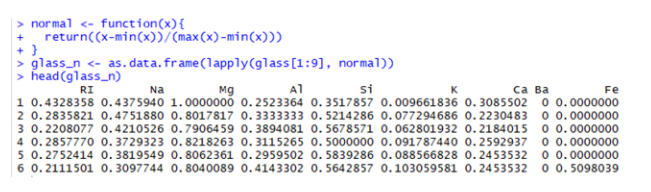
The data set got normalized.
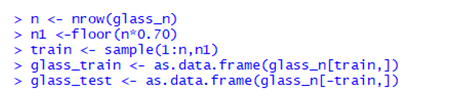
Let’s Split the normalized data set into training and test data using random sampling.
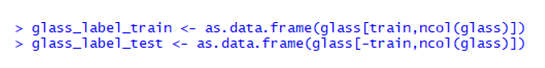
To get “Type” variable portioned, split glass dataset as follows:
Let's look at the proportions training and test data
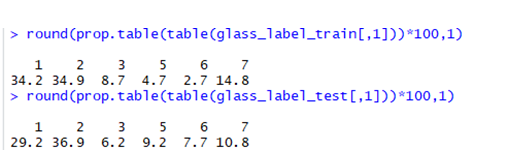
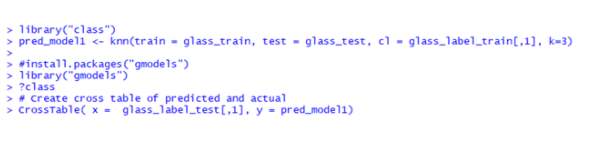
There is huge difference in proportions for different levels in training and test datasets KNN model using K=3 is built.


.svg)