![The Ultimate Guide to Statistical Analysis for Data Science [6 Step Framework]](https://www.excelr.com/uploads/blog/The_Ultimate_Guide_to_Statistical_Analysis_for_data_science_6_Step_Framework2.jpg)
7 Min Read
Statistics has proven to be the biggest game changer in the context of a business in the 21st century, leading to the boom of the new oil, that is “Data”.
Through this blog, we aim to provide a definitive understanding to the reader on how the process of Statistical Analysis for Data Science can be done on an actual business use case.
Let’s get started :
Data can be analysed to get valuable insights, but when analysis isn’t done, data is just a bunch of numbers that wouldn’t make any sense.
According to Croxton and Cowden,
Statistics is a Science of Collection, Presentation, Analysis and Interpretation of any numerical data.
A few examples include:
- Route Optimisation in Airlines Industry
- ROI Prediction of a company
- Stock Market Share Price Prediction
- Predictive Maintenance in Manufacturing
For any data set, statistical analysis for Data Science can be done according to the six points as shown below. They form the skeleton of statistical analysis.
The steps are as follows :
- Defining business objective of analysis
- Collection of Data
- Data Visualization
- Data Pre-Processing
- Data Modelling
- Interpretation of Data
Check Out Our Video On Statistical Analysis - Case Study (Sales of TATA Salt)
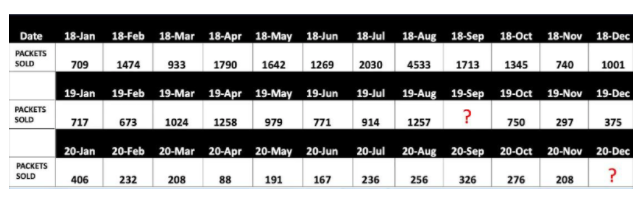
Let’s consider the case study (data set) of TATA salt sales from Jan 2018 to Nov2020. We use this data set for applying the above six steps.
The numbers are specified in quantities of packets of 1 kg that were sold. The sales team wants to get an idea regarding the quantity of salt packets that will be sold for December, 2020.
Step 1: Defining the objective of the analysis :
The first step is to understand the business objective and the reason for the analysis.
Objective can also be an exercise that is used to reduce costs, improve efficiency etc....
In this case, our objective is clear. It is to predict the quantity that will be sold for December 2020 using the past data.
Step 2: Collection of data
This is the most important step in the analysis process. Because here you have to collect the required data from various sources.
There are two methods of data collection that are commonly used :
Primary Data- It refers to the data that is freshly collected and is not used in the past. Primary data can be collected via surveys and personal observations. Primary Data can also be internal data of an organisation.
Eg : Here we have collected the data of the sales from January 2018 to November 2020 this is an example of primary data since it was the internal data of the company .
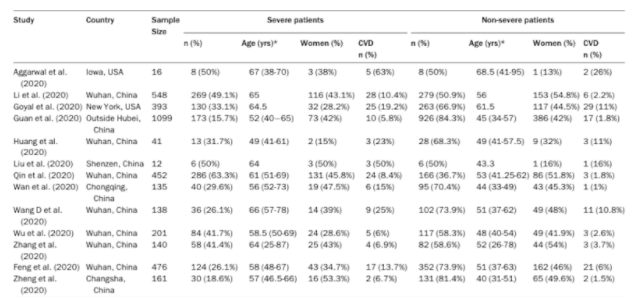
Secondary Data- It is the data collected by the other industries that are directly used for our analysis. Secondary data is pre existing information, which has already been collected and recorded by some researchers. Example, Covid-19 data, stock market data.
Eg : If an analysis has to be done for understanding the impact of Covid, the data has to be collected from a third party and hence it is secondary data.
https://www.kaggle.com/allen-institute-for-ai/CORD-19-research-challenge/discussion/150921
Step 3: Data Visualization
This step is crucial as it will help us understand the non-uniformities of the data in a data set. This will help us visualize the data in a manner that will help us fill the gaps and expedite the process of analysis. Various tools like Tableau,Power BI can be used for the purpose of Data Visualization.
Be A Tableau Certified Professional With ExcelR’s Tableau Course
Step 4: Data Pre-Processing
I. Data preprocessing/Data wrangling/Data cleaning:
Data preprocessing is the process of gathering, selecting, and transforming data for easier data analysis. It is also known as data cleaning or munging. It is the most important process, as it accounts to 80% of the total duration of analysis.
Data Preprocessing can be done using two methods :
- Missing Value Treatment
- Outlier Correction
Let’s understand Missing Value Treatment First :
i. Missing value treatment-
There could be several reasons behind the missing values like - human error, data incorrectly received, output error and so on.
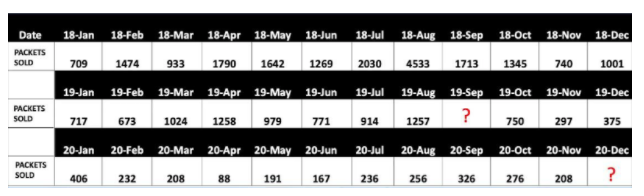
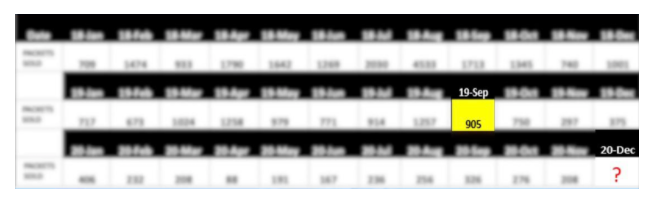
Let’s take a quick look at the data set that we have taken for our analysis. Do you agree that there are missing values in the table below ?
Yes, as you can see here the field 19- Sep doesn’t have any data and it’s crucial that these missing values are corrected properly, if not it might give misleading insights from the data.
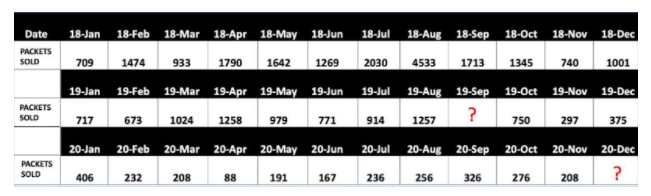
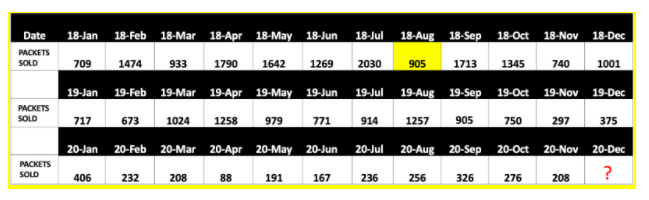
To fill these two missing values, we’ll use imputation techniques like mean, median, mode imputations.
Here, let's do mean imputation which shall replace those NA values by calculating mean value for the dataset. The mean imputed value of this dataset is 905 as highlighted in table below.
Here’s how to find the Mean Imputed Value.
So now we have a data set, that is suitable for proper analysis.
Let us now look at the second method of data pre-processing :
ii. Outlier correction/ Treatment:
Before we understand the procedure, let’s understand what outliers are:
An outlier is the data point which is distinctly different from all the other points in a dataset.
Eg: The sale of electronic goods during holidays like black Friday sale, new year and so on, could result in outliers in data of sales for that entire year. This is because the electronic goods sales are way higher in these days of the year when compared to normal days.
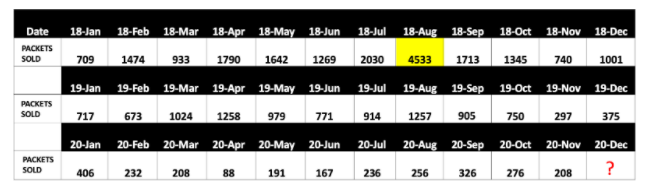
To detect outliers we have a simple technique called box plot method . The values that fall outside the upper and lower limit are called outliers.
Here we can see one outlier which is above the upper limit. The data point highlighted is an outlier.
Now here we have to correct this outlier by using different techniques like Mean, Median imputations . Here we replace the outlier by using the mean imputation value 905.
Step 5 : Data Modelling :
After data preprocessing, the data is ready for analysis. We must choose statistical techniques like ANOVA, Regression or any other methods, based on the variables in the data.
To find the sales for the month of Dec 2020, We will use the moving average technique.
Note : There are plenty of techniques like Moving Average, Exponential Smoothing, Advanced Smoothing etc… that can be used for forecasting sales. Here based on objective, the author's inclination is towards the moving average technique.
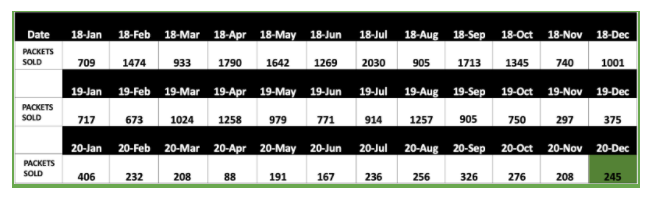
Based on the data, the sixth month moving average is 245. Here’s how we got the moving average.
Step 6: Interpretation:
We then come to the final step of our analysis which is Interpretation. Based on modelling analysis,our interpretation is that, for the month of December 2020 we can sell 245 packets of 1kg quantity. In this way, we can predict the future sales using historical data.
Conclusion
The 6 steps in this blog, enhances your understanding of various applications of statistical concepts in Data Science. Further stats can be divided into various categories like Descriptive Statistics, Inferential Statistics, Predictive Stats etc…. based on the data set and objective we deal with. Check out these blogs now and understand how each of these aspects of stats can be used in detail.


.svg)