
Course Description
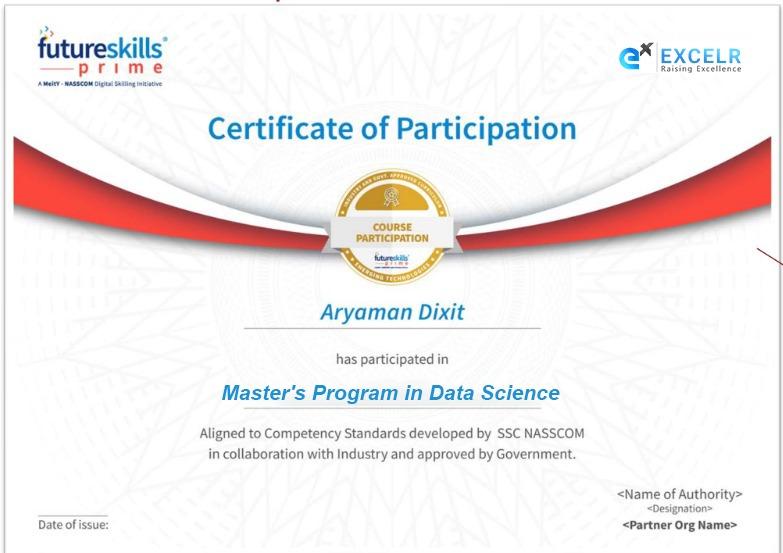
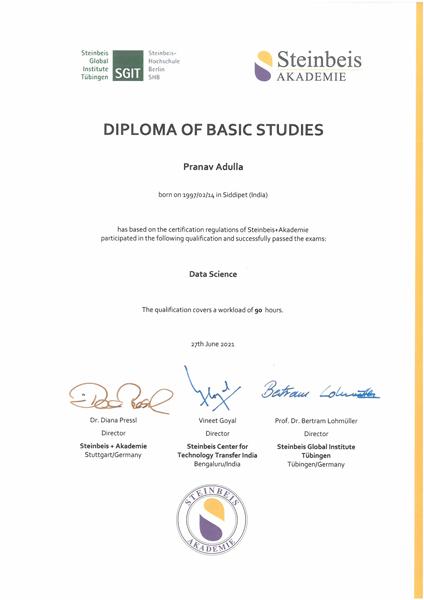
Data Science Certification from SGIT, Steinbeis University, Germany:
Accelerate your career with Data Science certification from SGIT, Steinbeis University Germany , one of the leading universities in Germany. This course is a perfect blend of theory, case studies and capstone projects. The course curriculum has been designed by Steinbeis University and considered to be the best in the industry. Get noticed by recruiters across the globe with the international certification. Post certification one will gain the alumnus status in Steinbeis University.
What is the certification process?
Post completion of the training, one should take an online examination facilitated by the university and should attain 60% or more to complete the course and gain the certification. Subsequently participants can check their alumnus status on SGIT , Steinbeis Global Institute Tübingen.
Data Science Course Training In Mumbai
ExcelR, as a leading institute of Data science courses in Mumbai , pay a lot of attention to the needs and requirements of the job market by keeping an eye out on the recent trending technologies. One such current trend that has swept the market away is Data Science for which there are myriad data science courses and here one can find the best Data science training. Today, almost every industry, domain and organization in them are using Data science as one of the major tools to help their business grow and adapt according to the demand and preferences of the customers. ExcelR’s curriculum, faculty and post training support is considered to be the best in the industry tailored to the needs of the Data Science job market. ExcelR’s Data Science course agenda has been meticulously designed with R Programming, Python , Machine Learning, Forecasting and Tableau addressing the complete Data life cycle.
What is Data Science & Data Science Course benefits?
In general terms, Data science is a pool of tools and techniques used to simplify the data so that it can be used to make business decisions. Owing to digitalization humongous data generation is in place which is waiting to be understood and visualized in a way that it can be useful by giving some insight into the subject.
Big companies tend to collect the data regarding the customer's behaviors, buying behavior, their likes and dislikes, reviews, etc. which will help them to evaluate their marketing plans, their products and services, all of which one can learn from our data science training in Mumbai.
In data science, data is collected, cleaned and then visualized to find the hidden patterns and get a prescriptive or a predictive viewpoint. Data science is a mixture of statistics, mathematics, computers, algorithms and some business acumen which makes it approachable and widespread in many ways. We, as the best Data Science Institute in Mumbai, make it a point to train our students, regardless of their domain using the best methods possible, master the concepts and help to build a successful career in the space of Data Science.
Some of the reasons why data science has become so significant in the organizations and why one should learn it from the best data science training institute are:
- find new challenges of the market and try to get answers for them
- helps in understanding the customers in a better way
- development of products and services
- find new trends and take actions accordingly
- test the decisions and make them more refined
- make quantifiable decisions
Data Science Course in demand
Data science throughout the last decade has been showing phenomenal growth and that is why one can also experience immense career growth in it as well. This is one of the reasons why our data science face-to-face training and online training has become so popular among new professionals and students. Some of the points proving that data science is highly demanded today are:
- According to Glassdoor, the average salary of a data scientist in a company can range from 5-100 lac per annum which is higher than many IT based fields or any field in general. Most of the companies are paying higher salaries to their data scientists almost as comparable to the global standards.
- As presented by NDTV, data science is a sector that Is facing manpower shortage and therefore making this the best time to grab the opportunity to become a data scientist and get placed in a respected position. Also, data science is supposed to see a growth of almost 8 times by 2025, making it one of the most pursued career choices.
- According to India today, the average Indian data science position pays around 11 lacs per year. The highest number of jobs is in Bangalore, followed by Delhi, Mumbai, Pune, and others. The companies that hire the data scientists the most are Accenture, IBM, KPMG, Deloitte, Honeywell, Wells Fargo, Amazon, Dell, etc. Mostly finance and banking sectors hire data scientists followed by healthcare, energy, e-commerce, media, etc.
- According to Economic times, India has been churning jobs in the field of data science in the last few years. With almost a 400% rise in the job vacancies and requirements and around 1.5 million job openings, the demand is quite high for qualified data science specialists.
- According to the Times of India, in the last few years, it is seen that the salary of data scientists has increased by approximately 20%, especially in startups and new ventures. The demand for data scientists has risen to complete various tasks in the tech companies which requires detailing and analyzing large amounts of data for various projects and for developing new products.
- PWC states that the number of positions for data science is quite high, but the requirement can be incomplete because of the lack of proper skills and knowledge. This is the reason why getting trained and skilled in data science and build a successful career and this why ExcelR is considered to be the best Data Science Institute in Mumbai.
- Harvard has expressed that data science is a subject that everybody wants to talk about and being a data scientist is also the most lucrative job of the decade. The interested party can capitalize the raw data into something that can catalyze growth for many large-scale businesses.
What are the USPs of ExcelR Data Science Course?
There are many points as to why students and professionals from all kinds of streams and sectors choose to join us at our data science institute. With our data science program, one can learn all of the details of data science and how to approach the subjects to achieve a promising job in the end. USPs that make us the best Data Science Institute in Mumbai are:
- Attend as many lectures and batches you want to with the JUMBO PASS throughout the time span of an entire year.
- Learn from the experienced industry experts with long-term teaching experience and data scientists with hands-on knowledge of the field and market passed down from IIT, IIM, and ISBs.
- Take advantage of the classroom programs, live sessions from the instructors and experts and recorded E-Learning videos that can be watched anytime according to one’s own comfort.
- 2 capstone projects where participant’s will work on full length Data Science lifecycle
- Practice and hone in on the skills with the help of more than 60 topic wise assignments.
- Get trained in data science with more than 160 hours of lectures and sessions.
- Get certified from Tata Consultancy Services (TCS-Ion)
- Machine Learning and Artificial Intelligence concepts as part of Data Science Course will be provided
- Get all the help needed after the completion of the course with mock interviews and resume building.
- Get full time placement assistance from our data science institute in several companies.
- ExcelR offers best Online training for data science Mumbai.
Who can take the Data Science Certification Course?
Data science has become such a pervasive field that almost everybody can be a part of this trend by learning new technologies and skills from our Data Science Institute in Mumbai. Anybody with a knowledge of mathematics, analysis, and business along with strong logical and analytical skills can be a part of this bandwagon of receiving the data science certification.
Those who can be successful by joining the data science course are:
- Business analysts
- Market analysts
- Software programmers
- Statisticians
- Mathematicians
- Economists
- Six Sigma consultants
- Domain specialists
- Freshers with good analytical skills
What is Covered in the Data Science Course Curriculum?
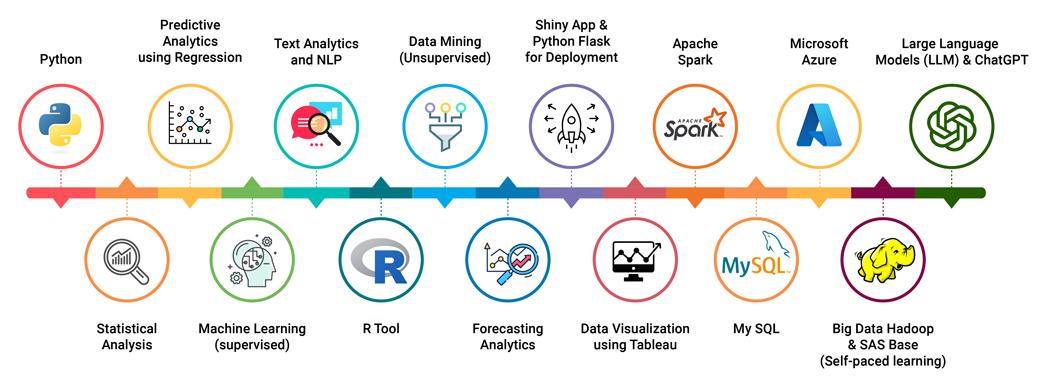
We understand the requirements of the market and what is demanded by the industry today and that is why we do our best to keep our data science training and data science online training module as available as possible. We keep the curriculum updated at all times by adding new technologies and topics of the market. A few of the topics topics covered in the data science course training as part of the curriculum :
- Python
- R studio
- SQL
- Data Collection
- Data Cleansing / Feature Engineering/ Exploratory Data Analysis
- Statistical Analysis
- Hypothesis Testing
- Regression-Linear Regression
- Logistic Regression
- Discrete Probability Distribution
- Advanced Regression
- Forecasting
- Data Visualization with Tableau
- Text Mining
- Data Mining Supervised- Naïve Bayes
- Machine Learning
- KNN
- SVD
- Decision Tree
- Random Forest
- Bagging And Boosting
- Black-box technique-SVM
- Neural Network
- Data Mining Unsupervised-Clustering
- Association Rule
- Data decomposition Techniques- PCA
- Natural Language Processing
Interview Preparation Sessions
Participants who have completed the Data Science course training and the projects will be put under our Placement Incubation Program. As part of this program, participants will undergo a thorough interview preparation process on Data Science. A huge repository of Data Science Interview questions with answers will be provided for the participants to prepare. A dedicated Data Science Subject Matter Expert (SME) will help in resume building, conduct mock interviews and evaluate each participant's knowledge, expertise and provide feedback. Our SMEs will do the necessary handholding on interview preparation process till the time the participant is placed. Guidance is also provided on Linkedin profile building and tricks of the trade to improve the marketability of the resume. - ExcelR Management
Course Curriculum
- Recap of Demo
- Introduction to Types of Analytics
- Project life cycle
- An introduction to our E learning platform
Description:Learn about the other moments of business decision as part of Statistical Analysis. Learn more about Visual data representation and graphical techniques. Learn about Python, R programming with respect to Data Science and Machine Learning. Understand how to work with different Python IDE and Python programming examples.
Topics
- Data Types
- Measure Of central tendency
- Measures of Dispersion
- Graphical Techniques
- Skewness & Kurtosis
- Box Plot
- R
- R Studio
- Descriptive Stats in R
- Python (Installation and basic commands) and Libraries
- Jupyter note book
- Set up Github
- Descriptive Stats in Python
- Pandas and Matplotlib / Seaborn
Topics
- Random Variable
- Probability
- Probility Distribution
- Normal Distribution
- SND
- Expected Value
- Sampling Funnel
- Sampling Variation
- CLT
- Confidence interval
- Assignments Session-1 (1 hr)
- Introduction to Hypothesis Testing
- Hypothesis Testing with examples
- 2 proportion test
- 2 sample t test
- Anova and Chisquare case studies
- Visualization
- Data Cleaning
- Imputation Techniques
- Scatter Plot
- Correlation analysis
- Transformations
- Normalization and Standardization
Description: Learn about Linear Regression, components of Linear Regression viz regression line, Linear Regression calculator, Linear Regression equation. Get introduced to Linear Regression analysis, Multiple Linear Regression and Linear Regression examples.
Topics
- Principles of Regression
- Introduction to Simple Linear Regression
- Multiple Linear Regression
Description: Learn about the Multiple Logistic Regression and understand the Regression Analysis, Probability measures and its interpretation. Know what is a confusion matrix and its elements. Get introduced to “Cut off value” estimation using ROC curve. Work with gain chart and lift chart.
Topics
- Multiple Logistic Regression
- Confusion matrix
- False Positive, False Negative
- True Positive, True Negative
- Sensitivity, Recall, Specificity, F1 score
- Receiver operating characteristics curve (ROC curve)
Description: Learn deployment using Rshiny and streamlit in R and python
Topics
- R shiny
- Streamlit
Description:As part of Data Mining Unsupervised get introduced to various clustering algorithms, learn about Hierarchial clustering, K means clustering using clustering examples and know what clustering machine learning is all about.
Topics
- Supervised vs Unsupervised learning
- Data Mining Process
- Hierarchical Clustering / Agglomerative Clustering
- Measure of distance
- Numeric - Euclidean, Manhattan, Mahalanobis
- Categorical - Binary Euclidean, Simple Matching Coefficient, Jaquard’s Coefficient
- Mixed - Gower’s General Dissimilarity Coefficient
- Types of Linkages
- Single Linkage / Nearest Neighbour
- Complete Linkage / Farthest Neighbour
- Average Linkage
- Centroid Linkage
- Measure of distance
- Visualization of clustering algorithm using Dendrogram
K-Means
Description:In this continuation lecture learn about K means Clustering, Clustering ratio and various clustering metrics. Get introduced to methods of making optimum clusters.
Topics
- Non-Hierarchial
- Measurement metrics of clustering - Within Sum of Squares, Between Sum of Squares, Total Sum of Squares
- Choosing the ideal K value using Scree plot / Elbow Curve
DBSCAN
Description:Introduction to Density based clustering method
Topics
- A geneal intuition for DBSCAN
- Different parameters in DBSCAN
- Metrics used to evaluate the performance of model
- Pro's and Con's of DBSCAN
Description:Learn to apply data reduction in data mining using dimensionality reduction techniques. Gain knowledge about the advantages of dimensionality reduction using PCA and tSNE
Topics
- PCA and tSNE
- Why dimension reduction
- Advantages of PCA
- Calculation of PCA weights
- 2D Visualization using Principal components
- Basics of Matrix algebra
Description:Learn one of the most important topic Association rules in data mining. Understand how the Apriori algorithm works, and the association rule mining algorithm.
Topics
- What is Market Basket / Affinity Analysis
- Measure of association
- Support
- Confidence
- Lift Ratio
- Apriori Algorithm
Description:Learn how online recommendations are made. Get insights about online Recommender System, Content-Based Recommender Systems, Content-Based Filtering and various recommendation engine algorithms. Get to know about people to people collaborative filtering and Item to item collaborative filtering.
Topics
- User-based collaborative filtering
- Measure of distance / similarity between users
- Driver for recommendation
- Computation reduction techniques
- Search based methods / Item to item collaborative filtering
- Vulnerability of recommender systems
- Workflow from data to deployment
- Data nuances
- Mindsets of modelling
Description:Decision Tree and is one of the most powerful classifier algorithms today. Under this tutorial learn the math behind decision tree algorithm with a case study
Topics
- Elements of Classification Tree - Root node, Child Node, Leaf Node, etc.
- Greedy algorithm
- Measure of Entropy
- Attribute selection using Information Gain
- Implementation of Decision tree using C5.0 and Sklearn libraries
Description: Learn about how to handle categorical data using different methods
Topics
- Encoding Methods
- OHE
- Label Encoders
- Outlier detection-Isolation Fores
- Predictive power Score
Description: It helps in reducing overfitting , training time and it improves accuracy
Topics
- Recurcive Feature Elimination
- PCA
Description:Here you are going to learn what are they ways to improve the models interms of accuracy and reducing overfitting ( Bias vs Variance )
Topics
- Splitting data into train and test
- Methods of cross validation
- Accuracy methods
Description:Rather working on a single model we can work on a diverse set of models it can achieved by using Ensemble learning
Topics
- Bagging
- Boosting
- Random Forest
- XGBM
- LGBM
Description:KNN and SVM: KNN algorithm is by far one of the easiest algorithms to learn and interpret. SVM is another most popular algorithm best part is it can be used for both classification and regression purpose, learn these two by using simple case studies
Topics
- Deciding the K value
- Building a KNN model by splitting the data
- Understanding the various generalization and regulation techniques to avoid overfitting and underfitting
- Kernel tricks
- Lasso Regression
- Ridge Regression
Description: Neural Networks: It is a supervised machine learning algorithm which mimics our human brain and it is foundation for Artificial Intelligence and Deep Learning. Here you learn the operation of neural networks using R and Python.
Topics
- Artificial Neural Network
- Biological Neuron vs Artificial Neuron
- ANN structure
- Activation function
- Network Topology
- Classification Hyperplanes
- Best fit “boundary”
- Gradient Descent
- Stochastic Gradient Descent Intro
- Back Propogation
- Intoduction to concepts of CNN
Description: Text mining or Text data mining is one of the wide spectrum of tools for analyzing unstructured data. As a part of this course, learn about Text analytics, the various text mining techniques, its application, text mining algorithms and sentiment analysis.
Topics
- Sources of data
- Bag of words
- Pre-processing, corpus Document-Term Matrix (DTM) and TDM
- Word Clouds
- Corpus level word clouds
- Sentiment Analysis
- Positive Word clouds
- Negative word clouds
- Unigram, Bigram, Trigram
- Vector space Modelling
- Word embedding
- Document Similarity using Cosine similarity
Description: Learn how to extract data from Social Media, download user reviews from E-commerce and Travel websites. Generate various visualizations using the downloaded data.
Topics
- Extract Tweets from Twitter
- Extract user reviews of the products from Amazon, Snapdeal and TripAdvisor
Description: Learn how to perform text analytics using Python and work with various libraries that aid in data extraction, text mining, sentiment analysis and
Topics
- Install Libraries from Shell
- Extraction and text analytics in Python
Description: Natural language processing applications are in great demand now and various natural language processing projects are being taken up. As part of this tutorial, learn about Natural language and ‘Natural language understanding’.
Topics
- Sentiment Extraction
- Lexicons and Emotion Mining
Description: Under the Naive Bayes classifier tutorial, learn how the classification modeling is done using Bayesian classification, understand the same using Naive Bayes example. Learn about Naive Bayes through the example of text mining.
Topics
- Probability – Recap
- Bayes Rule
- Naive Bayes Classifier
- Text Classification using Naive Bayes
Description: Forecasting or Time Series Analysis is an important component in analytics. Here, get to know the various forecasting methods, forecasting techniques and business forecasting techniques. Get introduced to the time series components and the various time series analysis using time series examples.
Topics
- Introduction to time series data
- Steps of forecasting
- Components of time series data
- Scatter plot and Time Plot
- Lag Plot
- ACF - Auto-Correlation Function / Correlogram
- Visualization principles
- Naive forecast methods
- Errors in forecast and its metrics
- Model Based approaches
- Linear Model
- Exponential Model
- Quadratic Model
- Additive Seasonality
- Multiplicative Seasonality
- Model-Based approaches
- AR (Auto-Regressive) model for errors
- Random walk
- ARMA (Auto-Regressive Moving Average), Order p and q
- ARIMA (Auto-Regressive Integrated Moving Average), Order p, d and q
- Data-driven approach to forecasting
- Smoothing techniques
- Moving Average
- Simple Exponential Smoothing
- Holts / Double Exponential Smoothing
- Winters / HoltWinters
- De-seasoning and de-trending
- Forecasting using Python and R
- Concept with a business case
- End to End project Description with deployment using R and Python
Assignments/Projects/Placement Support
- Basic Statistics
- Data types Identification and probability
- Expected values, Measures of central tendencies
- Skewness and Kurtosis & Boxplot
- Practice Mean, Median, Varience, Standard Deviation and Graphical representations in R
- Creating Python Objects
- Practice Mean, Median, Varience, Standard Deviation and Graphical representations in Python
- Confidence intervals and distributions
- Hypothesis Testing
- Buyer ratio
- Customer Order Form
- Cutlets
- Pantaloons
- Lab TAT
- Linear regression
- Prediction of weight based on Calories consumed
- Delivery Time period Vs Sorting time
- Employee Churn rate Vs Salary
- Salary Prediction
- R shiny and Flask
- Practice R shiny and Python Flask for Linear Regression assignments
- Multiple Linear Regression
- 50 startups case study
- Computer data Case study
- Toyota Corolla
- Logistic Regression
- Term deposit case study
- Elections results Case study
- Multinomial Regression
- Student Program Case study
- Hierarchical Clustering
- Crime data
- Eastwest Airlines
- K means Clustering
- Insurance policy
- Crime data
- PCA
- Dimension Reduction for Wine data
- Network Analytics
- Node Properties practice in R
- Association Rules
- Association Rules for Book store
- Association Rules for Mobile store
- Association Rules for Retail Transactions
- Recommendation Engine
- Recommend Jokes for subscribers
- Text mining, Web Extraction
- Extraction of tweets from twitter
- Reviews from ecommerce websites
- Text mining
- Sentiment Analysis on extracted data
- NLP
- Emotion mining by extracting a speech or novel from web
- Naive Bayes
- Spam and Ham classifications
- KNN Classifier
- Types of Glass
- Classification of Animals
- Decision Tree and Random Forest
- Fraud Check
- Sales prediction of an Organization
- XGB and GLM
- Social Networks Ads
- Lasso and Ridge Regression
- Practice Lasso and Ridge with multiple Linear Assignments
- ANN
- Forest Fires case study
- SVM
- Classification of Alphabets
- Survival analysis
- Prediction of Patient survival probability
- Forecasting model based
- Airlines Forecasting
- Forecasting of sales for a soft drinks case study
- Forecasting
- Forecasting of Bike shares
- Forecasting of Solar power consumption
- Industry : Aviation
Predicting the flight delays
- How to determine which flights would be delayed and by how long?
- Industry : Manufacturing
Predict impurity in ore
- The main goal is to use this data to predict how much impurity is in the ore concentrate As this impurity is measured every hour if we can predict how much silica (impurity) is in the ore concentrate, we can help the engineers giving them early information to take actions
- Industry : Oil and Gas
Predicting the oil price
- Oil production and prices data are for 1932-2014(2014 data are incomplete );gas production and prices are for 1955-2014 export and net export data are for 1986-2013
- Industry : Automotive
Electric Motor Temperature
- Predict the temperature of rotor and stator of E-Motor
- Industry : Daily Analysis of a product
"Daily" Twitter Data Analysis for a Product
- Sentiment Emotion mining of twitter data of new product
- Industry : E commerce
Natural Language Processing
- Top 5 relevant answers to be retrived based on input question
- Resume Preparation
- Interview Support
Value added courses
- Introduction to Big Data
- Challenges in Big Data and Workarounds
- Introduction to Hadoop and its Components
- Hadoop components and Hands-on
- Understand the MapReduce (Distributed Computation Framework) and its Drawback
- Introduction to Spark
- Spark Components
- Spark MLlib and Hands-on (one ML model in spark)
Introduction to R Programming
- Introduction to R
- Data Types in R
How To Install R & R Studio
Data Structures in R
- Variable in R
- R-Overview
- Vector
- Matrix
- Array
- List
- Data-Frame
- Operators in R
- arithmetic
- Relational
- Logical
- Assignment
- Miscellaneous
- Conditiional Statement
- Decision Making
- IF Statement
- IF-Else Statement
- Nested IF-Else Statement
- Switch Statement
- Loops
- While Loop
- Repeat Loop
- For Loop
- Strings
- Functions
- User-defined Function
- Calling a Function
- Calling a Function without an Argument
- Calling a Function with an Argument
- Decision Making
Programming Statistical
- Box Plots
- Bar Charts
- Histogram
- Pareto Chart
- Pie Chart
- Line Chart
- Scatterplot
How to Import Dataset in R
- Read CSV Files
- Read Excel Files
- Read SAS Files
- Read STATA Files
- Read SPSS Files
- Read JSON Files
- Read Text Files
R-Packages
- DpLyr
- Hmisc or mise
- Ggplot2
- Caret
- Data Table
How to Integrate R and SQL
How to Get Data From SQL to R
Introduction
- Python Introduction - Programing Cycle of Python
- Python IDE and Jupyter notebook
Variables
- Variables
- Data type
Code Practice Platform
- create , insert , update and delete operation , Handling erros
Operators
- Operator -Arthmatic ,comparison , Assignment ,Logical , Bitwise opeartor
- Decision making - Loops
Loops
- While loop, for loop and nested loop
- Number type conversion - int(), long(). Float ()
- Mathametical functions , Random function , Trigonometric function
Sting
- Strings- Escape char, String special Operator , String formatting Operator
- Build in string methods - center(), count()decode(), encode()
List
- Python List - Accessing values in list, Delete list elements , Indexing slicing & Matrices
- Built in Function - cmp(), len(), min(), max(), list comprehension
Tuples
- Tuples - Accessing values in Tuples, Delete Tuples elements , Indexing slicing & Matrices
- Built in tuples functions - cmp(), len ()
Dictionary
- Dictionary - Accessing values from dictionary, Deleting and updating elements in Dict.
- Properties of Dist. , Built in Dist functions & Methods, Dict comprehension
- Date & time -Time Tuple , calendor module and time module
Function
- Function - Define function , Calling function
- pass by refernece as value , Function arguments , Anonymous functions , return statements
- Scope of variables - local & global , Decorators and recursion
- Map reduce and filter
Modules
- Import statemnts , Locating modules - current directory , Pythonpath
- Dir() function , global and location functions and reload () functions , Sys module and subprocess module
- Packages in Python
Files
- Files in Python- Reading keyboard input , input function
- Opening and closing files . Syntax and list of modes
- Files object attribute- open , close . Reading and writing files , file Position.
- Renaming and deleting files
- Pickle and Json
Directories
- mkdir methid, chdir () method , getcwd method , rm dir
Exception Handling
- Exception handling - List of exceptions - Try and exception
- Try- finally clause and user defined exceptions
OOP
- OOP concepts , class , objects , Inheritance
- Overriding methods like _init_, Overloading operators , Data hiding
Regular Expressions
- match function , search function , matching vs searching
- Regular exp modifiers and patterns
SQLite and My SQL
- Data base connectivity
- Methods- MySQL , oracle , how to install MYSQL , DB connection
- create , insert , update and delete operation , Handling erros
Framework
- Introduction to Django framwork , overview , environment
- Apps life cycle , creating views
- Application, Rest API
- Introduction to What is DataBase
- Difference between SQL and NOSQL DB
- How to Install MYSQL and Workbench
- Connecting to DB
- Creating to DB
- What are the Languages inside SQL How to Create Tables inside DB and Inserting the Records
- Select statement and using Queries for seeing your data
- Joining 2 tables
- Where clause usage
- Indexes and views
- Different operations in SQL
- How to Connect to your applications from MYSQL includes R and Python
What is Data Visualization?
- Why Visualization came into Picture?
- Importance of Visualizing Data
- Poor Visualizations Vs. Perfect Visualizations
- Principles of Visualizations
- Tufte’s Graphical Integrity Rule
- Tufte’s Principles for Analytical Design
- Visual Rhetoric
- Goal of Data Visualization
Tableau – Data Visualization Tool
- Introduction to Tableau
- What is Tableau? Different Products and their functioning
- Architecture Of Tableau
- Pivot Tables
- Split Tables
- Hiding
- Rename and Aliases
- Data Interpretation
Tableau User Interface
- Understanding about Data Types and Visual Cues
Basic Chart types
- Text Tables, Highlight Tables, Heat Map
- Pie Chart, Tree Chart
- Bar Charts, Circle Charts
Intermediate Chart
- Time Series Charts
- Time Series Hands-On
- Dual Lines
- Dual Combination
Advanced Charts
- Bullet Chart
- Scatter Plot
- Introduction to Correlation Analysis
- Introduction to Regression Analysis
- Trendlines
- Histograms
- Bin Sizes in Tableau
- Box Plot
- Pareto Chart
- Donut Chart, Word Cloud
- Forecasting ( Predictive Analysis)
Maps in Tableau
- Types of Maps in Tableau
- Polygon Maps
- Connecting with WMS Server
- Custom Geo coding
- Data Layers
- Radial & Lasso Selection
Adding Background Image
- How to get Background Image and highlight the data on it
- Creating Data Extracts
- Filters and their working at different levels
- Usage of Filters on at Extract and Data Source level
- Worksheet level filters
- Context, Dimension Measures Filter
Data Connectivity in-depth understanding
- Joins
- Unions
- Data Blending
- Cross Database Joins
- Sets
- Groups
- Parameters
Creating Calculated Fields
- Logical Functions
- Case-If Function
- ZN Function
- Else-If Function
- Ad-Hoc Calculations
- Quick Table Calculations
- Level of Detail (LoD)
- Fixed LoD
- Include LoD
- Exclude LoD
Responsive Tool Tips
- Dashboards
- Actions at Sheet level and Dashboard level
- Story
Connecting Tableau with Tableau Server
- Publishing our Workbooks in Tableau Server
- Publishing dataset on to Tableau Server
- Setting Permissions on Tableau Server
Connecting Tableau with R
- What is R?
- How to integrate Tableau with R?
- Tableau Prep
Introduction to Neural Network & Deep Learning
Topics
- Introduction
- Deep Learning Importance [Strength & Limitation]
- SP | MLP
- Neural Network Overview
- Neural Network Representation
- Activation Function
- Loss Function
- Importance of Non-linear Activation Function
- Gradient Descent for Neural Network
Parameter & Hyper parameter
Topics
- Train, Test & Validation Set
- Vanishing & Exploding Gradient
- Dropout
- Regularization
- Optimization algorithm
- Learning Rate
- Tuning
- Softmax
CNN
Topics
- CNN
- Deep Convolution Model
- Detection Algorithm
- Face Recognition
RNN
Topics
- RNN
- LSTM
- Bi Directional LSTM
Introduction to ChatGPT and AI
- What is ChatGPT?
- The history of ChatGPT
- Applications of ChatGPT
- ChatGPT vs other chatbot platforms
- Industries using ChatGPT
- The benefits and limitations of ChatGPT
- Future developments in ChatGPT technology
- Ethical considerations related to ChatGPT and AI
Types of AI and Chatgpt architecture
- Narrow AI
- Strong AI
- Superintelligence
- Chatgpt architecture
ChatGPT Functionalities and Applications
- How does ChatGPT work?
- ChatGPT Functionalities
- Drafting emails and professional communication
- Automating content creation
- Resume and Cover letter creation
- Research and information gathering
- Brainstorming ideas and creative problem solving
- Best Practices for Using ChatGPT
ChatGPT Prompt Engineering
- What is Prompt Engineering?
- Types of Prompts
- Crafting Effective Prompts
- Using ChatGPT to generate prompt
Contact Our Team of Experts