
Data Science Course Training In Singapore
In association with :

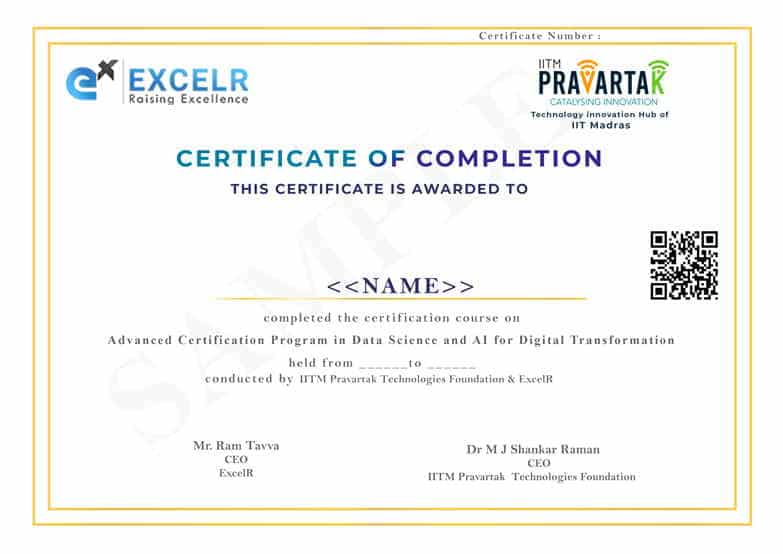
Certificate from prestigious IITM Pravartak

Students Enrolled
15,213

Reviews
4.8

Duration
6 Months
Immersive IITM Learning Experience
15+ Hours of Immersive Training at IITM Research Park campus for 2 days.
Interactive sessions by professors of IITM.
An industry-leading IITM Pravartak Certificate.
Internationally Valued Certification Credentials

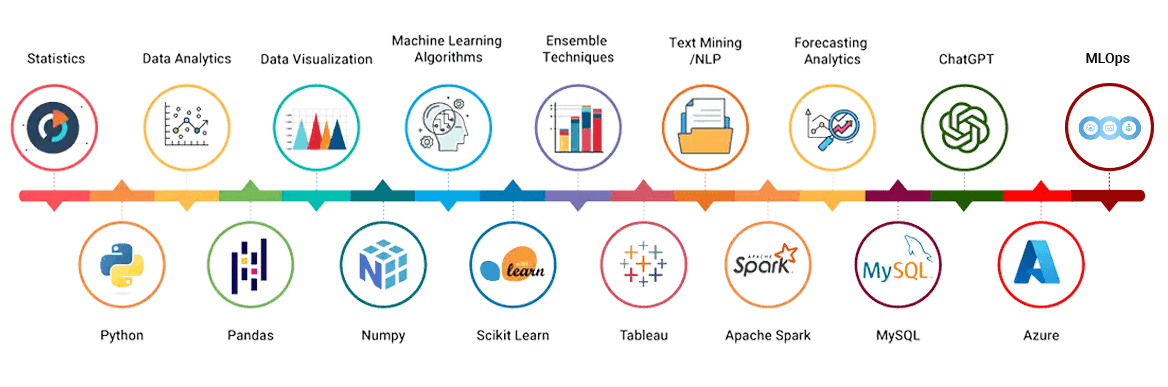
Master 15+ Industry-Leading Tools & Technologies
Data Science Certification from IITM Pravartak:
Accelerate your career with Data Science certification from IITM Pravartak , one of the leading universities in Germany. This course is a perfect blend of theory, case studies and capstone projects. The course curriculum has been designed by IITM Pravartak and considered to be the best in the industry. Get noticed by recruiters across the globe with the international certification. Post certification one will gain the alumnus status in IITM Pravartak.
What is the certification process?
Post completion of the training, one should take an online examination facilitated by the university and should attain 60% or more to complete the course and gain the certification. Subsequently participants can check their alumnus status on IITM Pravartak.
Advanced Certification Program in Data Science and AI for Digital Transformation from IITM Pravartak:
ExcelR, in association with IITM, brings to you an add-on certification for your Data Science Course.
This certification program provides you with:
- 15+ Hours of Interactive Live-Virtual Sessions by professors of IITM.
- Optional 2-day Campus Immersion in the beautiful, state-of-the-art IITM.
- A prestigious IITM Pravartak Certificate.
What is the certification process?
During the period of your course, interactive live-virtual sessions will be conducted by professors of IITM. An optional campus immersion will also be planned, whereby a slot will be created, and you will travel to Chennai for a two-day experience at the IITM campus. Post training, you will take a short quiz on the topics discussed in the session, which will unlock your Advanced Certification in Data Science and AI for Digital Transformation from IITM Pravartak.
Data Science Course Training
ExcelR offers Data Science course, the most comprehensive Data Science course in the market, covering the complete Data Science lifecycle concepts from Data Collection, Data Extraction, Data Cleansing, Data Exploration, Data Transformation, Feature Engineering, Data Integration, Data Mining, building Prediction models, Data Visualization and deploying the solution to the customer. Skills and tools ranging from Statistical Analysis, Text Mining, Regression Modelling, Hypothesis Testing, Predictive Analytics, Machine Learning, Deep Learning, Neural Networks, Natural Language Processing, Predictive Modelling, R Studio, Tableau, Spark, Hadoop, programming languages like R programming, Python are covered extensively as part of this Data Science training. ExcelR is considered as the best Data Science training institute which offers services from training to placement as part of the Data Science training program with over 400+ participants placed in various multinational companies including E&Y, Panasonic, Accenture, VMWare, Infosys, etc. ExcelR imparts the best Data Science training and considered to be the best in the industry.
Why Should You Choose ExcelR For Data Science Training?
If you are serious about a career pertaining to Data science, then you are at the right place. ExcelR is considered to be one of the best Data Science training institutes. We have built careers of thousands of Data Science professionals in various MNCs in India and abroad. “Training to Job Placement” – is our niche. We do the necessary hand-holding until you are placed. Our expert trainers will help you with upskilling the concepts, to complete the assignments and live projects.
ExcelR has a dedicated placement cell and has partnered with 150+ corporates which will facilitate the interviews and help the participants in getting placed. ExcelR is the training delivery partner in the space of Data Science for 5 universities and 40+ premier educational institutions like IIM, BITS Pilani, Woxen School of Business, University of Malaysia, etc. Faculty is our strength. All of our trainers are working as Data Scientists with over 15+ years of professional experience. Majority of our trainers are alumni of IIT, ISB and IIM and a few of them are PhD professionals. Owing to our faculty, ExcelR’s certification is considered to be the best Data Science certification offered in this space. ExcelR offers a blended learning model where participants can avail themselves classroom, instructor-led online sessions and e-learning (recorded sessions) with a single enrollment. A combination of these three modes of learning will produce a synergistic impact on learning. One can attend an unlimited number of instructor-led online sessions from different trainers for 1 year at no additional cost. No wonder ExcelR is regarded as the best Data Science training institute to master Data Science concepts and crack a job.
What Is Data Science? Who Is Data Scientist?
Data Science is all about mining hidden insights of data pertaining to trends, behaviour, interpretation and inferences to enable informed decisions to support the business. The professionals who perform these activities are said to be a Data Scientist / Science professional. Data Science is the most high-in-demand profession and as per Harvard and the most sort after profession in the world.
Why One Should Take The Data Science Course?
Is Data Science certification being worth pursuing as a career?
The answer is a big YES for myriad reasons. Digitalization across the domains is creating tons of data and the demand for the Data Science professionals who can evaluate and extract meaningful insights is increasing and creating millions of jobs in the space of Data Science. There is a huge void between the demand and supply and thereby creating ample job opportunities and salaries. Data Scientists are considered to be the highest in the job market. Data Scientist career path is long-lasting and rewarding as the data generation is increasing by leaps and bounds and the need for the Data Science professionals will increase perpetually.
- 1.4 Lakh jobs are vacant in Data Science, Artificial Intelligence and Big Data roles according to NASSCOM
- The world will notice a deficit of 2.3 Lakh Data Science professionals by 2021
- The Demand for Data Scientist professionals has increased by 417% in the year 2018, in India, as per the Talent Supply Index
- Data Science is the best job to pursue according to Glassdoor 2018 rankings
- Harvard Business Review stated that ‘Data Scientist is the sexiest job of the 21st century’
You May Question If Data Science Certification Is Worth It?
The answer is yes. Data Science / Analytics creating myriad jobs in all the domains across the globe. Business organizations realised the value of analysing the historical data in order to make informed decisions and improve their business. Digitalization in all the walks of the business is helping them to generate the data and enabling the analysis of the data. This is helping to create myriad data science/analytics job opportunities in this space. The void between the demand and supply for the Data Scientists is huge and hence the salaries pertaining to Data Science are sky high and considered to be the best in the industry. Data Scientist career path is long and lucrative as the generation of online data is perpetual and growing in the future.
Why ExcelR Is The Best Data Science Training Institute?
ExcelR offers the best Data Science certification online training along with classroom and self-paced e-learning certification courses. The complete Data Science course details can be found in our course agenda on this page.
Who Should Do The Data Science Course?
Professionals who can consider Data Science course as a next logical move to enhance in their careers include:
- Professional from any domain who has logical, mathematical and analytical skills
- Professionals working on Business intelligence, Data Warehousing and reporting tools
- Statisticians, Economists, Mathematicians
- Software programmers
- Business analysts
- Six Sigma consultants
- Fresher from any stream with good Analytical and logical skills
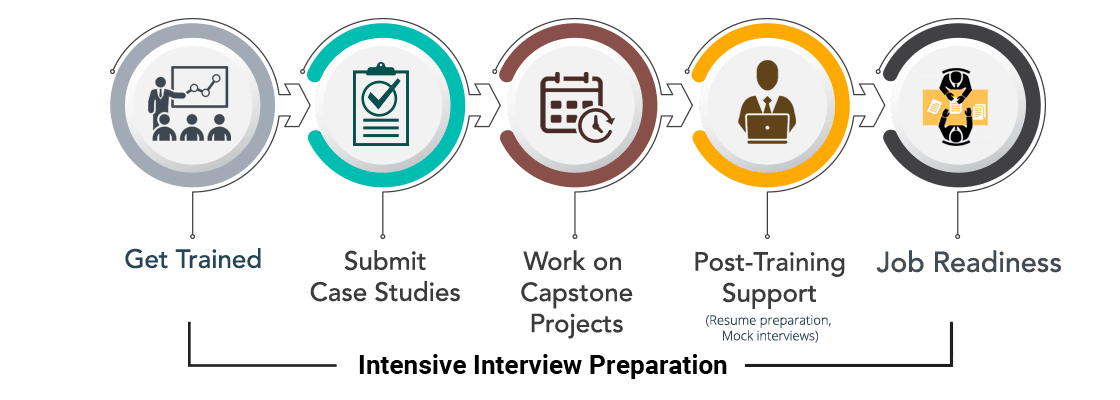
Interview Preparation Sessions
Participants who have completed the Data Science course training and the projects will be put under our Placement Incubation Program. As part of this program, participants will undergo a thorough interview preparation process on Data Science. A huge repository of Data Science Interview questions with answers will be provided for the participants to prepare. A dedicated Data Science Subject Matter Expert (SME) will help in resume building, conduct mock interviews and evaluate each participant's knowledge, expertise and provide feedback. Our SMEs will do the necessary handholding on interview preparation process till the time the participant is placed. Guidance is also provided on Linkedin profile building and tricks of the trade to improve the marketability of the resume. - ExcelR Management
Projects
"Daily" Twitter Data Analysis for a Product
As more and more people are expressing their views and opinions on various microblogging websites about various products and services. There has been a surge of data generated by the users, these websites have people sharing their thoughts daily.
Sentiment Analysis with the help of Natural Language Processing technique for identifying the sentiments of a product or service
Natural Language Processing
Customers are looking for more information before buying a product on E-commerce websites. Amazon introduced a new feature 'question and answer' search field for products.
The project is to build an information retrieval system from Amazon products data based on NLP techniques. Top 5 relevant answers to be retrieved based on input question
Predicting Loan defaulters
Reducing the risk of fraudulent loans by carefully evaluating the risk & at the same time increasing profits by rejecting only those loans, which have the potential of defaulting
Warranty Cost prediction
The objective of the analysis to predict an item when sold, what is the probability that customer would file for warranty and to understand important factors associated with them
Predict flight delays
Predict which flights would be delayed and by how long?
Flight delays cost the industry an estimated $25 billion every year More than 60 percent of frequent flyers cite delays among the things about air travel that they find most dismaying. And the costs are spread around - an extra $25 in parking here, a missed business meeting there. Carriers, meanwhile, pay an estimated $62 per minute in crew, fuel, maintenance and other costs. It adds up.
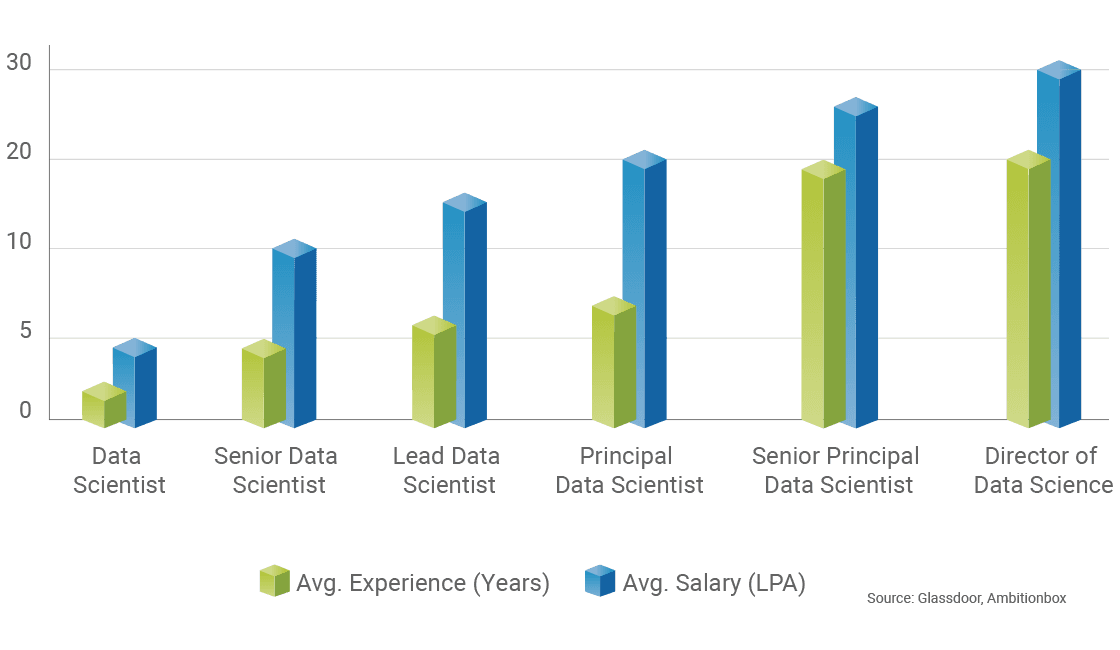
Career Progression and Salary Trends
Learning Path
Data Science
Module 1 - Demo - Datascience, DA vs DS vs AI
- What is Data Science? Use cases with Business Problem (Mobile/Banking) and How ML gives a solution, Types of Roles, what learnings are important, VAC courses offers, Jumbo Pass, Q & A.
Module 2 - Project Life Cycle
- ML Project Life Cycle(Problem, Collecting the data, EDA,Cleaning,Transformation, Partition, Model fitting, Cross validation, Metrics, Deployment),
Module 3 - Fundamentals of Stats - Basic Stat
- Sample, population, Data types(continous, discrete), Central tendency, spread, shape of the data such histogram, skewness, kurtosis
Module 4 - Statistical Charts - Basic Stat Contd..
- Bargraph, Box plot(IQR, Whisker lengths, outliers), Scatter plot( Positive , Negative, Neutral), correlation
Module 5 - Fundamentals of Python
- Intro to Python language,Anaconda Installation(Jupyter, Spyder), Datatypes(Int, Float,dic,Set), operators(Arthemetic,comparision,Logical, Assignment)
Module 6 - Python Contd..
- Data structures(List (types of list methods such as append ,extend ,insert ,remove ,pop ,clear ,index ,count ,sort ,reverse), tuples,dictionary,set), What are Control structures (if, ifelse, if elif, Nested if)
Module 7 - Python - Loops, Functions, Numpy
- For loop, functions, numpy(scalar,array, vector, 1 dim, 2 dim, random int), converting numpy to pandas, giving column names, Importing pandas, (read_csv, head, tail, describe)
Module 8 - Exploring Pandas
- Pandas (info, selecting columns, dropping columns, groupby, concat(row and columns),merge, removing duplicates, filling blanks with mean)
Module 9 - Data Visualization: EDA
- EDA (showing graphs such as histogram, boxplot, bargraph, scatter plot, heat map using matplotlib, seaborn) using Google collab with generative AI usage. Giving an example dataset ask them to work in class
Module 10 - Advance Stats - Probability - Normal distribution
- Probability, Normal distribution theory, standardization, zscore, z tables, applications, python code, confidence Interval
Module 11 - Advance Stats - Hypothesis Testing
- Level of significance, Hypothesis Testing (One sample Z test, Two sample Z test), t-test
Module 12 - Intro to Machine learning (Supervised Learning)and SLR
- Simple Linear Regression, metrics such RMSE and R square - Working on Age vs Weight example
Module 13 - Multiple Linear Regression
- Intro to Regression models , MLR - Assumptions of Linear Regression, Variable selection, Multicollinearity VIF
Module 14 - Logistic Regression
- what is meant by classification models ? When do we choose Logistic regression, modelfitting, confusion matrix, accuracy score - Working on Breast cancer case study
Module 15: Logistic Regression contd..
- Other metrics Sensitivity, Specificity, precision , F1 score, ROC curve, AUC score
Module 16: Data Transformation
- Data Transformation(Standardard scaler, minmax scaler, label encoding, one hot encoding) and Data partition (Training and Test)
Module 17: Modal Validation Techniques
- Cross validation (Stratified K-Fold, K-Fold cross validation,Shuffle Split Cross-Validation)
Module 18 - Under fitting to Over fitting
- Variance Biased Trade-off(under fitting-causes-Lack of training , best fit, over fitting - causes -Noise in training data,Too many training epochs or iterations, too many variables) ,Visualizations (Underfitting ,bestfit, Overfitting) and Feature Engineering - Working on Bangalore housing prices case study
Module 19 - Regularization
- Techniques such Lasso, Ridge, ElasticNet - Working on "Banglore housing prices" case study.
Module 20 - Classifiers - SVM
- Support vector machine (Hyperplane, Maximum margin classifier, Support Vectors, SVM for Linear Classification , SVM for Non-Linear Classification(polynomial, RBF, Sigmoid)
Module 21 - Decision Tree
- Decision Tree Structure(Root node,Internal nodes,terminal nodes),Gini Impurity, Entropy and Information Gain (for classification), Overfitting and Underfitting in Decision Trees, Pruning,Hyperparameters - Working on Sales data set using python
Module 22 - Ensembled Techniques
- Ensemble Methods: Bagging and Random forests , working on hyper parameters to control overfitting.
Module 23 - Boosting methods
- Sequential methods: Gradient Boosting, Ada Boost, using Grid search CV
- XG Boost, LightGBM
Module 24 - Deployment - Project Discussion
- Final project with Deployment
Module 25 - Unsupervised Learning
- What are DImensional Reduction Techniques ? 1. Purpose of PCA 2. Eigenvectors/Eigen values 3. Applications 4. Advantages 5. Working on case study
Module 26 - Clustering
- Introduction to Clustering, Distance Metrics,Clustering Algorithms(K mean, dbscan),Choosing the Right Number of Clusters(Elbow Method,Silhouette Analysis)
Module 27 - Recommendation system
- what is Recommendation and why it is important? What is Collaborative Filtering (CF) And Content-Based Filtering ?
Module 28 - Time series
- Time series Concepts, components, Visualization,Data partition, Lagplot, ARIMA models,Python code on ARIMA models
Module 29 - Deep Learning - Artifical Neural Network
- Perceptron , Single Layer Network, activation functions, Back propagation method, Simple ANN code
- Multilayer Neural network, Gradient Descent method, optimizers, learning rate - complete code with tensorflow
Module 30 - Deep Learning - Recurrent Neural Networks
- RNN - use cases, vanishing and exploiding problem, Simple RNN code
- LSTM Architecture, Working model, LSTM vs GRU, python code
Module 31 - Natural language processing
- What is Text Data,Various forms,Applications, Tex pre-processing(Tokenization,Normalization,Stopwords,Lemmatization,stemming), Visualization on preprocessed text data
- Text Representation: Bag of Words (BoW), Term Frequency-Inverse Document Frequency (TF-IDF), Sentiment Analysis, Classification model using ML
- Named Entity Recognition (NER), What is Word Embedding?
- What are pre-trained word Embeddings, Word2Vec(Skip gram, CBOW), real time applications, example codes
- Language Modeling: N-gram Models, Neural Language Models, applicaton of RNNs, LSTMs on Text data
Module 32 - Generative AI - Intro to LLM
- Large Language Models? Transfer Learnings in NLP, what are pre-trained models?
Module 33 - Generative AI - Applications of LLM's
- what are tansformers? Hugging Face transformers library and its use cases
Core Python
Module 34 - Introduction to Python, Variables
- Python Introduction - Programing Cycle of Python, Python Installation, Python IDE Variables , Data types
Module 35 - Operators,Data Structures
- Operator -Arthmatic ,Comparison , Assignment ,Logical , Bitwise opeartor, List, Tuple, Set, Dictironary
Module 36 - Conditional Statements and Loops
- Conditional Statements (if, if-else, if elif, Nested if), Loops in Python (for, while), Loop Control Statements(break, continue, pass)
Module 37 - Function
- Function - Define function , Calling function, pass by refernece as value , Function arguments , Anonymous functions , return statements Scope of variables - local & global,Lambda, map, filter, reduce
Module 38 - Modules and Packages
- Importing modules, Creating user-defined modules, Python Standard Library,Installing packages using pip
Module 39 - Data Cleaning and Preparation
- Importing the data,Handling Missing Data: ,Filtering Out Missing Data ,Filling In Missing Data ,Data Transformation ,Removing Duplicates
- Data Type Conversion, Detecting outliers using Boxplot, Z score, Handling Outliers (Capping,Transformation,Removal),
- Transforming Data Using a Function or Mapping ,Replacing Values , Feature Engineering such as Creating new variables ,Aggregations and groupings
Module 40 - Data Wrangling: Join, Combine,and Reshape
- Hierarchical Indexing,Combining and Merging multiple datasets (merge(), join(), concat()),Reshaping and Pivoting
Module 41 - Handling Time data using pandas
- Convert to datetime ,Extract attributes ,Create datetime range ,Resample data ,Time delta calculations ,Add time offset ,Time zone conversion ,Set datetime index ,Filter by date ,Handle missing time data
Module 42 - Exception Handling & Regular Expressions
- 1. Exception Handling : Try, except, else, finally ,Built-in exceptions ,Raising exceptions ,Custom exceptions ,Hands-on error handling tasks
- 2. Regular expressions: match function , search function , matching vs searching Regular exp modifiers and patterns
Module 43 - Object-Oriented Programming (OOP) - Part 1
- Class and Object, __init__ method , Attributes and methods, Hands-on: Create simple classes
Module 44 - Object-Oriented Programming (OOP) - Part 2
- Inheritance,Polymorphism,Hands-on: Real-world OOP examples
Module 45 - Object-Oriented Programming (OOP) - Part 3
- Encapsulation and Abstraction,Hands-on: Real-world OOP examples
Module 46 - Advanced Topics
- Iterators and Generators, Decorators
Tableau
Module 47 - Introduction to Tableau
- What is Tableau ?
- What is Data Visulaization ?
- Tableau Products
- Tableau Desktop Variations
- Tableau File Extensions
- Data Types, Dimensions, Measures, Aggregation concept
- Tableau Desktop Installation
- Data Source Overview
- Live Vs Extract
Module 48 - Basic Charts & Formatting
- Overview of worksheet sections
- Shelves
- Bar Chart, Stacked Bar Chart
- Discrete & Continuous Line Charts
- Symbol Map & Filled Map
- Text Table, Highlight Table
- Formatting: Remove grid lines, hiding the axes, conversion of numbers to thousands, millions, Shading, Row divider, Column divider Marks Card
Module 49 - Filters
- What are Filters ?
- Types of Filters
- Extract, Data Source, Context, Dimension, Measure, Quick Filters
- Order of operation of filters
- Cascading
- Apply to Worksheets
Module 50 - Calculations
- Need for calculations
- Types: Basic, LOD's, Table
- Examples of Basic Calculations: Aggregate functions, Logical functions, String functions, Tablea calculation functions, numerical functions, Date functions
Module 51 - Calculations Continued
- LOD's: Examples
- Table Calculations: Examples
Module 52 - Data Combining Techniques
- What is Data Combining Techniques ?
- Types
- Joins, Relationships, Blending & Union
Module 53 - Custom Charts
- Dual Axis
- Combined Axis
- Donut Chart
- Lollipop Chart
- KPI Cards (Simple)
- KPI Cards (With Shape)
Module 54 - Groups, Bins, Hierarchies, Sets, Parameters
- What are Groups ? Purpose
- What are Bins ? Purpose
- What are Hierarchies ? Purpose
- What are Sets ? Purpose
- What are Parameters ? Purpose and examples
Module 55 - Analytics & Dashboard
- Reference Lines
- Trend Line
- Overview of Dashboard: Tiled Vs Floating
- All Objects overview, Layout overview
- Dashboard creation with formatting
Module 56 - Dashboard Actions & Tableau Public
- Actions: Filter, Highlight, URL, Sheet, Parameter, Set
- How to save the workbook to Tableau Public website ?
Mysql
Module 57 -Introduction to Mysql
- Introduction to Databases, Introduction to RDBMS, Explain RDBMS through normalization, Different types of RDBMS , Software Installation(MySQL Workbench)
Module 58 - SQL Commands and Data Types
- Types of SQL Commands (DDL,DML,DQL,DCL,TCL) and their applications Data Types in SQL (Numeric, Char, Datetime)
Module 59 - DQL & Operators
- SELECT:LIMIT,DISTINCT,WHERE AND,OR,IN, NOT IN,BETWEEN, EXIST, ISNULL ,IS NOT NULL,Wild Cards, ORDER BY
Module 60 - Case When Then and Handling NULL Values
- Usage of Case When then to solve logical problems and handling NULL Values (IFNULL, COALESCE)
Module 61 - Group Operations & Aggregate Functions
- Group By, Having Clause. COUNT, SUM,AVG,MIN, MAX, COUNT String Functions, Date & Time Function
Module 62 - Constraints
- NOT NULL, UNIQUE, CHECK, DEFAULT, ENUM, Primary key,Foreign Key (Both at column level and table level)
Module 63 - Joins
- Inner, Left, Right, Cross, Self Joins, Full outer join
Module 64 - DDL Commands
- DDL: Create, Drop, Alter, Rename, Truncate, Modify, Comment
Module 65 - DML & TCL Commands
- DML: Insert, Update & Delete TCL: Commit, Rollback, Savepoint and Data Partitioning
Module 66 - Indexes and Views
- Indexes (Different Type of Indexes) and Views in SQL
Module 67 - Stored Procedure
- Stored Procedures - Procedure with IN Parameter, Procedure with OUT parameter, Procedure with INOUT parameter
Module 68 - Function, Constructs
- User Define Function, Window Functions - Rank, Dense Rank, Lead, Lag, Row_number
Module 69 - Union, Intersect, Sub-query
- Union, Union all,Intersect, Sub Queries, Multiple Query
Module 70 - Exception Handling, Loops, Cursor
- Handling Exceptions in a query, CONTINUE Handler, EXIT handler, Loops: Simple, Repeat, While Cursor
Module 71 - Triggers
- Triggers - Before | After DML Statement
MLOps
Module 72 - Intro to MLOps
- What is MLOps, Different stages in MLOps, ML project lifecycle, Job Roles in MLOps
Module 73 - Design and Development
- What is Development stage of an ML workflow , Pipelines and steps, Artifacts, Materializers, Parameters & Settings
Module 74 - Execution
- Stacks & components, Orchestrators, Artifact stores, Flavors etc.
Module 75 - Management
- ML Server infrastructure, Server deployment , Metadata tracking
- Collaborations, Dashboards
ChatGPT
Module 76 - Introduction to ChatGPT
- History and Development of ChatGPT,Examples of ChatGPT use in various industries, Basics of Transformers, Key concepts and principles of Generative AI,Examples of Generative AI models including ChatGPT, open source LLM's, Prompting basics, Overview of Different ChatGPT models
Module 77 - ChatGPT Prompting, Generic Applications
- Prompt Techniques, Few-shot Prompting, Zero Shot prompting, One-Shot Prompting, Chain of Thought Prompting ChatGPT applications in everyday life such as writing,translation and creativity, Explore ChatGPT potential for Education , Work, and Business Use Cases
Module 78 - ChatGPT Capabilities and advanced featues
- Code generation, code explaination, machine translation, structured and unstructred outputs, Canvas, deep research, image generation , video generation, codex, plugins, Browsing
Module 79 - ChatGPT in Everyday Tools and ML AI applications
- Utilizing ChatGPT for Excel, word, powerpoint, web development,data anlaysis, programing, Dashboards ,ChatGPTprojects etc.
Module 80 - ChatGPT for Interview Preparation and Job readiness
- Seeking jobs,career changes, working on resume, and updation, networking, job search strategies using ChatGPT, Linkedin Profile Optimization
Module 81 - API Integration & Custom Workflow Automation
- Introduction to OpenAI API & usage limits
- Authentication, Endpoint usage
- Integrating GPT with Python, Google Sheets, Excel, Power BI Zapier, Make, LangChain basics
Artificial Intelligence
Module 82 - Fundamentals of Mathematics and Revision of ANN
- 1. Linear Algebra: Vectors, matrices, dot product, matrix multiplication
- 2. Calculus: Derivatives, partial derivatives, chain rule (for backpropagation)
- 3. Review on ANN
Module 83 - Detail explantion on Artificial Neural Networks
- 1. What is Gradient Descent in detail? Connectivity of Calculus in Back propagation. Weight & Bias Updates,
- 2. Types of Loss functions(MSE, Binary Cross entropy (Binary & Muliti)
- 3. Overfitting Solutions(Dropout, Early stopping)
- 4.Types of Optimizers and acitvations functions its applications
- 5. Example Case study
Module 84 - CNN
- 1. CNN,DeepConvolutionModel,DetectionAlgorithm, CNN FaceRecognition
- 2. Working on MNIST data set
Module 85 - Web Scrapping
- 1. Introduction to Web Scraping & Web Basics,
- 2. Python Libraries for Web Scraping (requests, BeautifulSoup)
- 3. HTML & Web Page Structure Basics
Module 86 - Web Scrapping Application integrated with ML
- Selecting a website and extract the data
- 1. To Extract Image, Reviews, Ratings, and Price Tags
- 2. Store in Structured Format
- 3.
- a) Image classfication from images
- b) Sentiment analysis from Reviews
- c) Regression model from Prices.
Big Data
Module 87 - Intro to Big data technologies
- What is big data, characteristics of big data, technologies in big data etc.
Module 88 - Intro to Spark environment
- what is spark environment, spark documentation, installation of spark , spark concepts
Module 89 - Integration of Spark Platform
- Integration with different languages like python , r, scala, etc. Introducing pyspark environment , pyspark basics and functions
Module 90 - Pyspark Concepts
- Pyspark RDD structures, dataframe modules, sql modules , examples , exercise problems, working on datasets
Module 91 - Pyspark ML Concepts
- Pyspak ML libraries, Regression models, linear and logistic regression and clustering basics, tree based models, ensemble concepts
Module 92 - Pyspark ML Applications
- Pyspark ML applications, with excercises, visualizations
Module 93 - Databricks environment
- What is databricks, account creation, cluster creation, working on pyspark applications in databricks with r, python and scala
Module 94 - Intro to AWS cloud
- What is aws cloud, account creation , understanding basic aws enevironment and knowledge
Module 95 - Hadoop environment
- What is hadoop , hadoop architecture, creating hadoop environment on AWS cloud, install java, install hadoop and related concepts
Module 96 - Hadoop applications
- Running applications like map reduce on data , getting insights , doing analysis, word count problems etc.
Azure
Module 97 - Intro to Cloud Computing
- What is cloud computing, why it is important, cloud services, applications, benefits , architectures
Module 98 - Intro to Azure Cloud Platform
- What is Azure, Why Azure, Azure services, Azure core architecture, core azure services domains, creation of azure account
Module 99 - Azure Cloud Applications
- Intro to AI/ML services, What is azure ml designer studio, developing ml models, python and r applications in studio
Module 100 - Azure Cloud Services
- Resource groups, virtual machine concepts , storage service, web apps, databricks environment , azure sql databases, billing etc.
Module 101 - Azure open AI Studio
- What is azure open ai, open ai documentation, how to use azure open ai studio, creating applications, different models in azure open ai
Basic Of R
Module 102 - Introduction to R, Installation of R Studio, Data types in R
- Data types(Numeric, Char, logical, Complex, Vector, List, Matrix, Factor, Array, Data frame), Relational Operators, Logical Operators
Module 103 - Decision Making statements, Loops, Functions
- If, Ifesle, For loop, While loop, Repeat, Functions
Module 104- Built in Functions in R, Joins, dplyr and ggplot2
- Merging data frames, Analyzing Iris Dataset using apply functions, dplyr package(Filter, Set, Arrange), Data Visuzlization using ggplot2, Scatterplot, Histogram, Boxplot
Contact Our Team of Experts
Why ExcelR?
Participants Placed Through ExcelR

Githin James

Anushri Agarwal

Apoorva

Avimanyu Basu

Bharat Kumar

Faraz

Gopal

Manasa
.jpg&w=384&q=75)
Manohar

Nalini Khade

Yogesh

Rajeswar Rao

Vikram Arora

Vishal Dixit
Sushant

Swetha
Dinesh

Vasantha
Amit MG
Agarwal Subham
Murali

Nikhil
Teja

Saurabh Chawla
Prayash
Mihir
Shirin

Sayantan
Santhosh
Anup Harne
Nitin Mishra

Chetan Reddy Velma

Santosh Kumar Isukapalli

Tarakeshwari Junge

Naveen Reddy
Pavan
Rajashekar
Byl Lavanya
Saif

Nagaraj
Nagireddy
Venu
Raj
Sai Krishna

Neha

Swostiman

Hari
Pradeep
Sneha
Praveen
Bhagya Lakshmi
Saipriya

Midhun
2.jpg&w=384&q=75)
Madhavi
2.jpg&w=384&q=75)
Tanya
2.jpg&w=384&q=75)
Rohan
Bhavana Tangirala
1.jpg&w=384&q=75)
Alisha Kar
1.jpg&w=384&q=75)
Ruhi Ragini

Gopal
1.jpg&w=384&q=75)
Pragya

Rajan
Testimonials


FAQs
What Is JUMBO PASS?
- The all new and exclusive JUMBO PASS is the latest initiative taken by ExcelR to offer you access to attend unlimited batches over the duration of 365 days. You will be able to attend unlimited number of classes for the course of your choice.
What Are The Prerequisites For This Data Science Training?
- As such, there is no prerequisite for undertaking this training. However, it is highly desirable if you possess the following skills sets
- Mathematical and Analytical expertise
- Good critical thinking and problem-solving skills
- Technical knowledge of Python, R and SAS tools
- Communication skills
What Are The Career Opportunities For Data Science Professionals?
- Data Science has become the spine around which crucial company decisions are made. Organizations are paying top dollars to recruit Business Analytics professionals and the demand is only going to increase with the influx of data from new sources. The career roles that you can cherry pick are
- Data Analyst
- Research Analyst
- Data Scientist
- Data Analyst
- Big Data Analytics Specialist
- Business Analyst Consultant / Manager
What Kind Of Salary Can I Expect As A Data Science Professional?
- Just as the saying goes - You reap what you sow, your experience plays an important factor in determining the package that you will be offered
- Entry Level - Up to 5 Lakhs
- Intermediate Level - Up to 8 Lakhs
- Experienced Level - Up to 12.5 Lakhs
- Advanced Level - Up to 18 Lakhs
- Expert Level - More than 25 Lakhs
What Is Instructor-Led Online Training?
- Instructor-led online training is an interactive mode of training where participants and trainer will log in at the same time and live sessions will be done virtually. These sessions will provide scope for active interaction between you and the trainer.
How Many Batches Can I Attend, If Enrolled For Training?
- ExcelR offers a blended model of learning. In this model participants, can attend classroom, instructor-led live online and e-learning (recorded sessions) with a single enrolment. A combination of these 3 will produce a synergistic impact on the learning. One can attend multiple Instructor-led live online sessions for one year from different trainers at no additional cost with the all new and exclusive JUMBO PASS.
Is This A Live Training Or Recorded Sessions?
- The training is a live instructor-led interactive session done at a specific time where participants and trainer will log in at the same time. The same session will be also recorded and access will be provided to revise, recap or watch a missed session.
Whom Should I Contact If I Want to Know More Information About The Training?
- You can reach out to us by visiting our website and interact with our live chat support team. Our customer service representatives will assist you with all your queries. You can also send us an email at enquiry@excelr.com with your query and our Subject Matter Experts / Sales Team will clarify your queries or call us on 1800-212-2121 (Toll-Free number – India), +1(281) 971-3065 (USA), 800 800 9706 (India), 203-514-6638 (United Kingdom), 128-520-3240 (Australia).
What If I Miss A Live Session?
- Not a problem even if you miss a live Data Science session for some reason. Every session will be recorded and access will be given to all the videos on ExcelR’s state-of-the-art Learning Management System (LMS). You can watch the recorded Data Science sessions at your own pace and convenience.
Will I Get A Data Science Course Completion Certification From ExcelR?
- Yes, after successfully completing the course you will be awarded a course completion certificate from ExcelR.
What Are The Different Modes Of Payment Available?
- The different payment methods accepted by us are
- Cash
- Net Banking
- Cheque
- Debit Card
- Credit Card
- PayPal
- Visa
- Mastercard
- American Express
- Discover
Global Presence
ExcelR is a training and consulting firm with its global headquarters in Houston, Texas, USA. Alongside to catering to the tailored needs of students, professionals, corporates and educational institutions across multiple locations, ExcelR opened its offices in multiple strategic locations such as Australia, Malaysia for the ASEAN market, Canada, UK, Romania taking into account the Eastern Europe and South Africa. In addition to these offices, ExcelR believes in building and nurturing future entrepreneurs through its Franchise verticals and hence has awarded in excess of 30 franchises across the globe. This ensures that our quality education and related services reach out to all corners of the world. Furthermore, this resonates with our global strategy of catering to the needs of bridging the gap between the industry and academia globally.
