
Mean value of a dataset is the average value i.e. a number around which a whole data is spread out. All values used in calculating the average are weighted equally when defining the Mean
The median is basically the 'middle' number in an ordered data set. Let's see how it works for our example. ... The median of the data set is the number at position n plus 1, divided by two in the ordered list, where n is the number of observations.
If your variable of interest is measured in nominal or ordinal (Categorical) level then Mode is the most often used technique to measure the central tendency of your data. Finding the mode is easy. Basically, it is the value that occurs most frequently.
Lets get deep into these topic to get a perfect picture of it
Pizza Prices Data
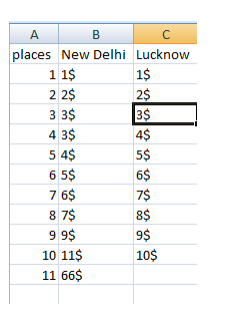
Mean — Mean means average.you can find above dataset’s average prices for both(New delhi and lucknow) then the formula is —
mean=sum of the whole prices /number of prices
So here mean of new delhi is — 10.63
(1+2+3+3+4+5+6+7+9+11+66)/11=10.63
and mean of lucknow prices is — 5.5
(1+2+3+4+5+6+7+8+9+10)/10=5.5
there is a problem with the mean, let’s see the mean which we got for new delhi is so high because of only last 66$ value.whole dataset for new delhi is not too high but due to last one our mean become higher so this is not good.
For this problem there is Median —
The median is the number at position of (n+1)/2 in ordered dataset.where n is the number of data number.
Fortunately our data is ordered.
median of new delhi price — 6th position price — 5$
(11+1)/2=6
median of lucknow price — 6th position price — 5.5$
(10+1)/2=5.5, it is 5.5 so we take average of 5 and 6 position prices.
As you can see that new delhi prices mean was 10.63 and now it’s median is 5$ so this technique gave little bit valuable information of whole new delhi prices.
Now there is one more, Mode.
Mode is decided by the frequency. The value which has more frequency in dataset column is mode.
So in our dataset new delhi price mode is 3$ and lucknow price mode is none because there is no repetition of any value. You can say that there are 10 modes but it’s make no sense.
Conclusion:
If your data has a symmetric distribution the mean is often used. Example: men's heights are probably bell-shaped. It makes sense to refer to the middle peak of that bell, because most men's heights will be somewhere near that number. If your data is skewed (i.e. has a very long tail in one direction but not the other) the median is often used. Example: incomes. Most people make let's say $50k. But there's one person who makes $300 million. The mean will average these out, and end up being something like $200 million, let's say. That's deceptive because most people do not make anywhere near that. The median, however, will be near $50,000, since by definition, half of the sample must be below, and half above that number. If your data is discrete the mode may be preferred. Example: answering "yes", "maybe" or "no" to a question on a survey. The mode will tell us the most frequent response. The mean and median in this case can't even be calculated unless "yes" "maybe" and "no" are given numeric values.


.svg)